


Kluczowe wnioski z Living Planet Symposium 2025
Dr Jędrzej Bojanowski, Director of EO Data Science and Products
Udział w ESA Living Planet Symposium 2025 w Wiedniu był wyjątkowym doświadczeniem. Skala wydarzenia była imponująca - ponad 7300 uczestników (w tym 6800 uczestniczyło na miejscu) ze 119 krajów, co pokazuje, co pokazuje jak globalna i dynamiczne stała się społeczność sektora obserwacji Ziemi z całego świata. Z ponad 250 sesjami, 60 agorami i ponad 4200 prezentacjami i posterami naukowymi, w całym obiekcie panowało poczucie rozmachu i innowacji. CloudFerro odegrało aktywną rolę w tegorocznym wydarzeniu, wnosząc wkład w ponad 30 działań - wygłaszanie prezentacji podczas sesji tematycznych, prowadzenie i moderowanie dyskusji, udział w panelach, prowadzenie tutoriali i prezentowanie posterów. Szczególnie ważne były dla nas interakcje z użytkownikami inicjatyw, które współtworzymy, takich jak CDSE User Review Meeting i Destination Earth User Exchange Forum. Byliśmy obecni na trzech stoiskach - CloudFerro, CDSE i ESA - gdzie przeprowadziliśmy setki cennych rozmów z uczestnikami.
Poniżej przedstawiamy kilka ważnych wniosków, które wyciągnęliśmy z tego wydarzenia oraz spostrzeżeń jak działania i innowacje CloudFerro wpisują się w trendy i osiągnięcia całego sektora obserwacji Ziemi.
Wyższa dostępność wynoszenia satelitów na orbitę
Wynoszenie satelitów na orbitę staje się coraz łatwiejsze i bardziej przystępne cenowo. Podstawowym wyzwaniem jest obecnie wybór odpowiednich sensorów, które wygenerują dane zarówno do dalszych badań naukowych, jak i zastosowań komercyjnych. Dostawcy segmentu naziemnego starają się odpowiedzieć na rosnący w tej dziedzinie popyt. W szczególności CloudFerro oferuje pełen łańcuch wartości - od pozyskiwania danych po ich przechowywanie i przetwarzanie w chmurze, aż po zaawansowane przetwarzanie i efektywne wydawanie danych użytkownikom.
Standardy danych
Podczas wielu wystąpień był poruszany temat standardów danych, w szczególności w kontekście Spatio Temporal Asset Catalog (STAC), który jest popularnym sposobem organizowania i udostępniania danych geoprzestrzennych. Chociaż wiele organizacji korzysta ze STAC, wciąż istnieją pewne wyzwania. Na przykład różne narzędzia sprawdzają dane STAC w odmienny sposób, co prowadzi do niespójności pomiędzy katalogami. Niemniej jednak użytkownicy pozytywnie wyrażali się na temat udostępnienia danych wg standardów STAC w ekosystemie danych programu Copernicus.
Przejście na formaty natywne
Obserwujemy obecnie przejście z tradycyjnych formatów danych, takich jak SAFE/JPEG2000, na formaty zoptymalizowane do obliczeń w chmurze, takie jak Zarr. Rozwój wersji 3 Zarr i geoZarr ma na celu rozwiązanie kwestii dotyczących zarządzania wieloma małymi plikami czy zawarcia piramid obrazowych, które pozwalają na szybkie przesyłanie danych w różnych powiększeniach (tzw. zoom level). Pozostają też kwestie optymalnego dzielenia danych na części (tzw. chunk'i), które stanowią osobne pliki oraz umieszczonych w nich metadanych. Odrębnym tematem pozostają obawy dotyczące zapewnienia ciągłości danych w miarę przechodzenia programu Copernicus na nowe formaty.
Trendy w sztucznej inteligencji i uczeniu maszynowym
Integracja sztucznej inteligencji i uczenia maszynowego była ważnym tematem. Opublikowanie przez Google osadzeń (tzw. embeddings) dla globalnych danych satelitarnych - 64-wymiarowych wektorów odpowiadających każdemu pikselowi obrazów satelitarnych z jednego roku - zostało uznane za znaczący postęp. Warto zauważyć, że CloudFerro opublikowało już wcześniej globalne embeddingi dla danych Sentinel, które zostały pozytywnie przyjęte. Potencjał tych narzędzi i nowych formatów danych może znacząco zmienić sposób wykorzystywania danych z obserwacji Ziemi. Przede wszystkim podstawą do budowania algorytmów będą nie jak dotychczas obrazy, ale dane przetworzone przez AI i niemożliwe do interpretacji wizualnej. Istnieje przekonanie, że sztuczna inteligencja pomoże w fuzji danych z różnych sensorów oraz wypełnianiu braku w danych (w czasie i przestrzeni), a zapotrzebowanie na dane o wyższych rozdzielczościach przestrzenno-czasowych nie maleje.
I oczywiście, europejski ból głowy, czyli tematy bezpieczeństwa, odporności i zrównoważonego rozwoju powracały w różnych kontekstach. W CloudFerro nie możemy się już doczekać, kiedy będziemy mogli wnieść nasze doświadczenia i suwerenne usługi chmurowe do programu ESA - European Resilience from Space (ERS), który w przyszłości ma stać się europejskim systemem Earth Observation Governmental Service (EOGS).
Zaangażowanie społeczności i federacja danych
Coraz większy nacisk kładziony jest na federację danych i współpracę użytkowników. Rośnie zainteresowanie dostępem do wielu źródeł danych za pośrednictwem jednego interfejsu API, co napędza ruch w kierunku bardziej otwartych, opartych na współpracy środowisk. Oczekuje się, że wspólna architektura Earth Observation Exploitation Platform Common Architecture (EOEPCA) będzie stanowić standard dla usług federacyjnych, co znajduje również odzwierciedlenie w strategii działania CloudFerro.
Przetwarzanie w chmurze jako standard
Przetwarzanie w chmurze stało się standardową praktyką w sektorze obserwacji Ziemi, a CloudFerro zyskało uznanie podczas Sympozjum za swój wkład w tym obszarze. Chociaż na początku mogliśmy być postrzegani jako niszowy dostawca, platformy takie jak CREODIAS, którego jesteśmy operatorem, stają się obecnie coraz bardziej znane i darzone zaufaniem przez użytkowników. Zebraliśmy pozytywne opinie, zwłaszcza dotyczące tego, jak nasze usługi pomagają w efektywnym przetwarzaniu dużych ilości danych satelitarnych, z naciskiem na znaczenie stosowania otwartych standardów. Bycie częścią tej społeczności nadal inspiruje nas do ciągłego doskonalenia i jeszcze większego wspierania naszych użytkowników.
Dziękujemy wszystkim, których spotkaliśmy za angażujące dyskusje na stoiskach CloudFerro, CDSE i ESA, a także za wszystkie opinie na temat naszych prezentacji, sesji i posterów. Cały czas rozwijamy dla Was usługi CloudFerro i wspieramy społeczność obserwacji Ziemi, aby wszyscy chętni mogli w pełni korzystać z bogactwa danych Copernicusa zamieniając je w informacje użyteczne dla całego społeczeństwa.
Running private LLM on CloudFerro Virtual Machine
by Mateusz Ślaski, Sales Support Engineer
Introduction
Running a Large Language Model (LLM) on your own Virtual Machine with a high-performance GPU offers several advantages:
- Privacy and Security: You maintain control over your data, reducing the risk of exposure associated with third-party platforms.
- Performance Optimization: You can optimize and configure your environment specifically for your workload, potentially achieving lower latency and faster processing times.
- Customization: You have the flexibility to adjust system resources and settings to tailor the performance and capabilities of the LLM to your specific needs.
- Cost Efficiency: By controlling the computing resources, you can manage costs more effectively, especially if you have fluctuating demands or take advantage of SPOT instances. Additionally VM with LLM shared thru API between team members will replace need of equiping them with local GPU able to run LLM.
- Scalability: You can scale your resources up or down based on demand, allowing you to handle varying workloads efficiently.
- Reduced Dependency: Operating your LLM reduces reliance on third-party infrastructure (in this case you would be dependent only on independent Cloud Provider operating in Europe under EU law), giving you greater independence and control over its operation and maintenance.
- Access to Advanced Features: Cloud operator is able to provide high-performance GPU difficult to purchase by smaller companies, you can test and leverage advanced features and capabilities of LLMs that require significant computational power.
- Continuous Availability: You achieve high availability and reliability, as the virtual machine can be configured to meet uptime requirements without interruptions often associated with shared platforms.
What will you learn from this document?
- You will learn how to run a private Large Language Model (LLM) on a CloudFerro virtual machine using the self hosted Ollama platform.
- You will start by creating a VM on the CREODIAS platform by selecting the appropriate GPU and AI-related options
- Once you set up SSH access, you will verify the GPU visibility to ensure the NVIDIA drivers load correctly.
- You will then proceed with the Ollama installation and verify its ability to recognize the GPU.
- Furthermore, you will be guided on downloading and testing small LLM models from the Ollama Library.
- Next you get details on advanced configurations, including how to expose the Ollama API for network access and set up a reverse proxy with SSL certificates and Basic Authentication for added security.
- Additionally, you will address potential security considerations when you expose the API, either within a cloud tenant or publicly.
Manual procedure
VM creation
To create the VM, please follow this document:
How to create a new Linux VM in OpenStack Dashboard Horizon on CREODIAS
Please note that whaen making the two steps you must choose the GPU and AI related options.
1. When a source image is selected, please use one of the *_NVIDIA_AI images (two Ubuntu and one CentOS are available).
2. An instance must be created with one of the following flavors:
(as available at the end of March 2025)
- WAW3-1
- vm.a6000.1 (1/8 of shared A6000 card)
- vm.a6000.2 (1/4 of shared A6000 card)
- vm.a6000.4 (1/2 of shared A6000 card)
- vm.a6000.8 (full shared A6000 card)
- WAW3-2
Standard instances- gpu.h100 (One H100 card available)
- gpu.h100x2 (Two H100 cards available)
- gpu.h100x4 (Four H100 cards available)
- gpu.l40sx2 (Two L40s cards available)
- gpu.l40sx8 (Eight L40s cards available)
- vm.l40s.1 (1/8 of shared L40s card)
- vm.l40s.2 (1/4 of shared L40s card)
- vm.l40s.4 (1/2 of shared L40s card)
- vm.l40s.8 (full shared L40s card)
Spot instances - spot.vm.l40s.1 (1/8 of shared L40s card)
- spot.vm.l40s.2 (1/4 of shared L40s card)
- spot.vm.l40s.4 (1/2 of shared L40s card)
- spot.vm.l40s.8 (full shared L40s card)
- FRA1-2
- vm.l40s.2 (1/4 of shared L40s card)
- vm.l40s.8 (full shared L40s card)
- WAW4-1
- A new GPU flavors for H100 and L40s NVIDIA GPUs will be available soon (~ end of April 2025).
This tutorial was prepared using "vm.a6000.8" flavor and "Ubuntu 22.04 NVIDIA_AI" image on WAW3-1 region.
Accessing VM with SSH
To configure just created instance, we will access it using SSH.
Depending on the operating system that you use on your local computer, choose one of the below documents:
GPU check
The first step is checking if the GPU is visible by the system and if NVIDIA drivers are loaded properly.
You should be able to run the command:
nvidia-smiAnd you should get the following output:
Fri Mar 21 17:28:32 2025
+---------------------------------------------------------------------------------------+
| NVIDIA-SMI 535.161.07             Driver Version: 535.161.07   CUDA Version: 12.2     |
|-----------------------------------------+----------------------+----------------------+
| GPU  Name                 Persistence-M | Bus-Id        Disp.A | Volatile Uncorr. ECC |
| Fan  Temp   Perf          Pwr:Usage/Cap |         Memory-Usage | GPU-Util  Compute M. |
|                                         |                      |               MIG M. |
|=========================================+======================+======================|
|   0  NVIDIA RTXA6000-48Q            On  | 00000000:00:05.0 Off |                    0 |
| N/A   N/A    P8              N/A /  N/A |      0MiB / 49152MiB |      0%      Default |
|                                         |                      |             Disabled |
+-----------------------------------------+----------------------+----------------------+

+---------------------------------------------------------------------------------------+
| Processes:                                                                            |
|  GPU   GI   CI        PID   Type   Process name                            GPU Memory |
|        ID   ID                                                             Usage      |
|=======================================================================================|
|  No running processes found                                                           |
+---------------------------------------------------------------------------------------+
Please note that GPU memory usage is 0MiB of the amount available per selected flavor because it is not used yet.
Ollama installation
According to the official instruction at [Ollama dowload page for Linux](https://ollama.com/download/linux) it is enough to run a single installation script:
curl -fsSL https://ollama.com/install.sh | sh -->You should see the following output with the last message stating that Ollama sees GPU.
>>> Installing ollama to /usr/local
>>> Downloading Linux amd64 bundle
######################################################################## 100.0%
>>> Creating ollama user...
>>> Adding ollama user to render group...
>>> Adding ollama user to video group...
>>> Adding current user to ollama group...
>>> Creating ollama systemd service...
>>> Enabling and starting ollama service...
Created symlink /etc/systemd/system/default.target.wants/ollama.service → /etc/systemd/system/ollama.service.
>>> NVIDIA GPU installed.
Please note that this installation script not only downloads and installs packages, but additionally runs Ollama web service locally.
If you execute the command:
systemctl status ollamayou will get this output:
● ollama.service - Ollama Service
     Loaded: loaded (/etc/systemd/system/ollama.service; enabled; vendor preset: enabled)
     Active: active (running) since Fri 2025-03-21 19:35:50 UTC; 2 days ago
   Main PID: 110150 (ollama)
      Tasks: 22 (limit: 135297)
     Memory: 1.7G
        CPU: 33.690s
     CGroup: /system.slice/ollama.service
             └─110150 /usr/local/bin/ollama serve

Mar 21 20:57:45 llm-tests ollama[110150]: llama_init_from_model: graph splits = 2
Mar 21 20:57:45 llm-tests ollama[110150]: key clip.use_silu not found in file
Mar 21 20:57:45 llm-tests ollama[110150]: key clip.vision.image_grid_pinpoints not found in file
Mar 21 20:57:45 llm-tests ollama[110150]: key clip.vision.feature_layer not found in file
Mar 21 20:57:45 llm-tests ollama[110150]: key clip.vision.mm_patch_merge_type not found in file
Mar 21 20:57:45 llm-tests ollama[110150]: key clip.vision.image_crop_resolution not found in file
Mar 21 20:57:45 llm-tests ollama[110150]: time=2025-03-21T20:57:45.432Z level=INFO source=server.go:619 msg="llama runner started in 1.01 seconds"
Mar 21 20:57:46 llm-tests ollama[110150]: [GIN] 2025/03/21 - 20:57:46 | 200 |  2.032983756s |       127.0.0.1 | POST     "/api/generate"
Mar 23 19:36:29 llm-tests ollama[110150]: [GIN] 2025/03/23 - 19:36:29 | 200 |       59.41µs |       127.0.0.1 | HEAD     "/"
Mar 23 19:36:29 llm-tests ollama[110150]: [GIN] 2025/03/23 - 19:36:29 | 200 |     538.938µs |       127.0.0.1 | GET      "/api/tags"
To test out Ollama installation, we will download 2 small models from Ollama Library.
ollama pull llama3.2:1b
ollama pull moondream
Each of them should give a similar output:
pulling manifest
pulling 74701a8c35f6... 100% ▕█████████████████████████████████████▏ 1.3 GB
pulling 966de95ca8a6... 100% ▕█████████████████████████████████████▏ 1.4 KB
pulling fcc5a6bec9da... 100% ▕█████████████████████████████████████▏ 7.7 KB
pulling a70ff7e570d9... 100% ▕█████████████████████████████████████▏ 6.0 KB
pulling 4f659a1e86d7... 100% ▕█████████████████████████████████████▏  485 B
verifying sha256 digest
writing manifest
success
Verify that they are visible:
ollama listYou should see them on the list
NAME                ID              SIZE      MODIFIED
moondream:latest    55fc3abd3867    1.7 GB    47 hours ago
llama3.2:1b         baf6a787fdff    1.3 GB    2 days ago
Please test them by executing one or both commands below.
Remember that to exit the chat ,you need to use /bye command.
ollama run moondreamOr
ollama run llama3.2:1bNow, if you execute:
nvidia-smiCommand.
Then you should have a similar output:
Fri Mar 21 20:58:40 2025
+---------------------------------------------------------------------------------------+
| NVIDIA-SMI 535.161.07             Driver Version: 535.161.07   CUDA Version: 12.2     |
|-----------------------------------------+----------------------+----------------------+
| GPU  Name                 Persistence-M | Bus-Id        Disp.A | Volatile Uncorr. ECC |
| Fan  Temp   Perf          Pwr:Usage/Cap |         Memory-Usage | GPU-Util  Compute M. |
|                                         |                      |               MIG M. |
|=========================================+======================+======================|
|   0  NVIDIA RTXA6000-48Q            On  | 00000000:00:05.0 Off |                    0 |
| N/A   N/A    P8              N/A /  N/A |   6497MiB / 49152MiB |      0%      Default |
|                                         |                      |             Disabled |
+-----------------------------------------+----------------------+----------------------+

+---------------------------------------------------------------------------------------+
| Processes:                                                                            |
|  GPU   GI   CI        PID   Type   Process name                            GPU Memory |
|        ID   ID                                                             Usage      |
|=======================================================================================|
|    0   N/A  N/A      1514      C   /usr/local/bin/ollama                      4099MiB |
|    0   N/A  N/A      1568      C   /usr/local/bin/ollama                      2395MiB |
+---------------------------------------------------------------------------------------+
It shows Ollama processes on the list and memory consumption being sum of loaded models.
As mentioned before, the Linux service with Ollama API server should already run in the background.
You may test it with the following Curl request:
curl http://localhost:11434/api/generate -d '{
  "model": "moondream",
  "prompt": "Why milk is white?"
}'
You will receive a bunch of json response messages containing a model answer
{"model":"moondream","created_at":"2025-03-23T19:50:31.694190903Z","response":"\n","done":false}
{"model":"moondream","created_at":"2025-03-23T19:50:31.701052938Z","response":"Mil","done":false}
{"model":"moondream","created_at":"2025-03-23T19:50:31.704855264Z","response":"k","done":false}
{"model":"moondream","created_at":"2025-03-23T19:50:31.70867345Z","response":" is","done":false}
{"model":"moondream","created_at":"2025-03-23T19:50:31.712496186Z","response":" white","done":false}
{"model":"moondream","created_at":"2025-03-23T19:50:31.716349912Z","response":" because","done":false}
...
Bigger size models
For now to make this tutorial fluent, we used small models with the size of about 1 GB.
If we have a GPU with more memory we may do test using bigger model. Let's try Llama3.3 with size of 42GB.
When you type name of model in search box on Ollama Libray then you get a list of models with this text in name. Copy model tag and use it locally.
You may activate the download of the model and then run it by a single command.
ollama run llama3.3:latestOr only download the model for further usage:
ollama pull llama3.3:latestTag "llama3.3:latest" should be also used in Curl query when communicating with API.
Additional setup if necessary
If you execute command
ollama serve --helpYou will see a list of environment variables allowing to tune configuration according to your requirements and the hardware used.
In the next section we will set up one of them.
Start ollama
Usage:
  ollama serve [flags]

Aliases:
  serve, start

Flags:
  -h, --help   help for serve

Environment Variables:
      OLLAMA_DEBUG               Show additional debug information (e.g. OLLAMA_DEBUG=1)
      OLLAMA_HOST                IP Address for the ollama server (default 127.0.0.1:11434)
      OLLAMA_KEEP_ALIVE          The duration that models stay loaded in memory (default "5m")
      OLLAMA_MAX_LOADED_MODELS   Maximum number of loaded models per GPU
      OLLAMA_MAX_QUEUE           Maximum number of queued requests
      OLLAMA_MODELS              The path to the models directory
      OLLAMA_NUM_PARALLEL        Maximum number of parallel requests
      OLLAMA_NOPRUNE             Do not prune model blobs on startup
      OLLAMA_ORIGINS             A comma separated list of allowed origins
      OLLAMA_SCHED_SPREAD        Always schedule model across all GPUs

      OLLAMA_FLASH_ATTENTION     Enabled flash attention
      OLLAMA_KV_CACHE_TYPE       Quantization type for the K/V cache (default: f16)
      OLLAMA_LLM_LIBRARY         Set LLM library to bypass autodetection
      OLLAMA_GPU_OVERHEAD        Reserve a portion of VRAM per GPU (bytes)
      OLLAMA_LOAD_TIMEOUT        How long to allow model loads to stall before giving up (default "5m")
Exposing Ollama API for other hosts in network - Internal use
Edit the file with Ollama service configuration (if necessary replace vim with your editor of choice).
sudo vim /etc/systemd/system/ollama.serviceBy default Ollama is exposed on localhost and port 11434, so it can not be accessed from other hosts in the project. To change the default behavior we add a line, setting Ollama to expose API on All interfaces and lower range port. For this article, we choose port 8765.
Environment="OLLAMA_HOST=0.0.0.0:8765"In [service] section.
So updated File would look like this:
[Unit]
Description=Ollama Service
After=network-online.target

[Service]
ExecStart=/usr/local/bin/ollama serve
User=ollama
Group=ollama
Restart=always
RestartSec=3
Environment="OLLAMA_HOST=0.0.0.0:8765"
Environment="PATH=/opt/miniconda3/condabin:/usr/local/cuda/bin:/usr/local/sbin:/usr/local/bin:/usr/sbin:/usr/bin:/sbin:/bin:/usr/games:/usr/local/games:/snap/bin"

[Install]
WantedBy=default.target
After this change we have to update the services.
sudo systemctl daemon-reloadsystemctl restart ollama.serviceAnd check if it is running properly.
systemctl status ollama.serviceIf we go now to another VM in the same network and execute a similar Curl request - modified only by changing IP address and port.
curl http://LLM_TEST_VM_IP:8765/api/generate -d '{
  "model": "moondream",
  "prompt": "Why milk is white?"
}'
Important remark:
If we expose API directly in this way in other port, then command ollama wouldn't work. The message will be:
Error: could not connect to ollama app, is it running?It is because the command uses the same API and tries to access it on the default port 11434.
We have to execute the command:
export OLLAMA_HOST=0.0.0.0:8765Or even add it to ~/.bashrc file to make the change permanent.
API security
You have to consider one important thing. Now Ollama API is exposed not only to a single network but also to all hosts in other networks in your project.
If this is not acceptable, you should consider some security settings.
- The first is to create a separate external router and network according to this document:
How to create a network with router in Horizon Dashboard on CREODIAS
API still will be exposed but only inside of a single network. - If it is still not acceptable, then use guidelines from the next chapter.
Exposing Ollama API
In this case we will leave default API sttings for localhost and port 11434. Instead we add reverse proxy that expose API on other port and eventually add some authorization.
sudo apt install nginx
sudo apt install apache2-utils
Set Basic Authentication password. You must retype the password twice.
cd /etc
sudo htpasswd -c .htpasswd ollama
Exposing in cloud tenant
Simple NGINX configuration with basic auth but http only.
For internal usage only!
Strongly not recommending using when exposing API in public Internet.
user www-data;
worker_processes auto;
pid /run/nginx.pid;
include /etc/nginx/modules-enabled/*.conf;
events {
  worker_connections 768;
}
http {
  server {
    listen 8765;
    # Basic authentication setup
    auth_basic "Restricted Area";
    auth_basic_user_file /etc/.htpasswd; # File containing usernames and hashed passwords
    location / {
      proxy_pass http://127.0.0.1:11434;
    }
  }
}
Test Curl request:
curl -u "ollama:YOUR_PASSWORD" http://10.0.0.148:8765/api/generate -d '{
  "model": "llama3.3:latest",
  "prompt": "Who is Peter Watts?"
}'
Exposing API with encryption
Assign public IP to your machine with Ollama using this guide:
How to Add or Remove Floating IP’s to your VM on CREODIAS
Obtain SSL certificate for this IP or domain name and put it in two files on VM:
/etc/ssl/certs/YOUR_CERT_NAME.crt/etc/ssl/private/YOUR_CERT_NAME.key
Or generate a self-signed certificate.
It would be enough for personal or small team usage, but not if you want to expose API for customers or business partners.
sudo openssl req -x509 -nodes -days 365 -newkey rsa:4096 -keyout /etc/ssl/private/YOUR_CERT_NAME.key -out /etc/ssl/certs/YOUR_CERT_NAME.crt -subj "/C=PL/ST=Mazowieckie/L=Warsaw/O=CloudFerro/OU=Tech/CN=OllamaTest"Simple NGINX config with basic auth and https.
user www-data;
worker_processes auto;
pid /run/nginx.pid;
include /etc/nginx/modules-enabled/*.conf;
events {
        worker_connections 768;
        # multi_accept on;
}
http {
  server {
    listen 8765 ssl;
    server_name testing-ollama;
    # Path to SSL certificates
    ssl_certificate /etc/ssl/certs/YOUR_CERT_NAME.crt;
    ssl_certificate_key /etc/ssl/private/YOUR_CERT_NAME.key;
    # Basic authentication setup
    auth_basic "Restricted Area";
    auth_basic_user_file /etc/.htpasswd; # File containing usernames and hashed passwords
    location / {
      proxy_pass http://127.0.0.1:11434;
    }
  }
}
Curl test request.
With accepting self signed certificate by -k option:
curl -k -u "ollama:YOUR_PASSWORD" https://YOUR_IP_OR_DOMAIN:8765/api/generate -d '{
  "model": "llama3.3:latest",
  "prompt": "Who is Peter Watts?"
}'
Automated workflow with Terraform
Prerequisites / Preparation
Before you start, please read the documents:
- "Generating and Authorizing Terraform using a Keycloak User on CREODIAS" https://creodias.docs.cloudferro.com/en/latest/openstackdev/Generating-and-authorizing-Terraform-using-Keycloak-user-on-Creodias.html
- "How to Generate or Use Application Credentials via CLI on CREODIAS": https://creodias.docs.cloudferro.com/en/latest/cloud/How-to-generate-or-use-Application-Credentials-via-CLI-on-Creodias.html We will use them to authenticate the Terraform OpenStack provider.
- Additionally, you may review:
- Official Terraform documentation: https://developer.hashicorp.com/terraform
- Terraform OpenStack Provider documentation: https://registry.terraform.io/providers/terraform-provider-openstack/openstack/latest/docs
If necessary, you may also refresh some details about the manual management of: projects, key-pairs, networks, and security groups:
- https://creodias.docs.cloudferro.com/en/latest/networking/Generating-a-SSH-keypair-in-Linux-on-Creodias.html
- https://creodias.docs.cloudferro.com/en/latest/cloud/How-to-create-key-pair-in-OpenStack-Dashboard-on-Creodias.html
- https://creodias.docs.cloudferro.com/en/latest/networking/How-to-Import-SSH-Public-Key-to-OpenStack-Horizon-on-Creodias.html
- https://creodias.docs.cloudferro.com/en/latest/cloud/How-to-use-Security-Groups-in-Horizon-on-Creodias.html
- https://creodias.docs.cloudferro.com/en/latest/networking/How-to-create-a-network-with-router-in-Horizon-Dashboard-on-Creodias.html
Step 1 - Select or Create a Project
You may use the default project in your tenant (usually named "cloud_aaaaa_bb") or create a new one by following the document mentioned below. https://creodias.docs.cloudferro.com/en/latest/openstackcli/How-To-Create-and-Configure-New-Project-on-Creodias-Cloud.html
Step 2 - Install Terraform
There are various ways to install Terraform, some of them are described in the documentation mentioned in the "Preparation" chapter.
If you are using Ubuntu 22.04 LTS or newer and you do not need the latest Terraform release (for the Terraform OpenStack provider, it is not necessary), the easiest way is to use Snap.
First, install Snap:
sudo apt install snapdThen install Terraform:
sudo snap install terraform --classicStep 3 - Allowing Access to Project from Terraform
Now create Application Credentials.
Please follow the document: "How to Generate or Use Application Credentials via CLI on CREODIAS": https://creodias.docs.cloudferro.com/en/latest/cloud/How-to-generate-or-use-Application-Credentials-via-CLI-on-Creodias.html
When you have them ready, save them in a secure location (i.e., password manager) and fill in the variables in the "llm_vm.tfvars" file.
Step 4 - Prepare Configuration Files
As Terraform operates on the entire directory and automatically merges all "*.tf" files into one codebase, we may split our Terraform code into a few files to manage the code more easily.
- main.tf
- variables.tf
- resources.tf
- locals.tf
Additionally, we need two other files:
- llm_vm_user_data.yaml
- llm_api_nginx.conf
- llm_vm.tfvars
File 1 - main.tf
In this file, we keep the main definitions for Terraform and the OpenStack provider.
terraform {
  required_version = ">= 0.14.0"
  required_providers {
    openstack = {
      source  = "terraform-provider-openstack/openstack"
      version = "~> 1.51.1"
    }
  }
}

provider "openstack" {
  auth_url    = var.auth_url
  region      = var.region
  user_name =  "${var.os_user_name}"
  application_credential_id = "${var.os_application_credential_id}"
  application_credential_secret = "${var.os_application_credential_secret}"
}
File 2 - variables.tf
In this file, we will keep variable definitions.
variable os_user_name {
  type = string
}

variable tenant_project_name {
  type = string
}

variable os_application_credential_id {
  type = string
}

variable os_application_credential_secret {
  type = string
}

variable auth_url {
  type = string
  default = "https://keystone.cloudferro.com:5000"
}

variable region {
  type = string
  validation {
    condition = contains(["WAW3-1", "WAW3-2", "FRA1", "FRA1-2", "WAW4-1"], var.region)
    error_message = "Proper region names are: WAW3-1, WAW3-2, FRA1, FRA1-2, WAW4-1"
  }
}

#Our friendly name for entire environment.
variable env_id {
  type = string
}

# Key-pair created in previous steps
variable env_keypair {
  type = string
}


variable internal_network {
  type = string
  default = "192.168.12.0"
  validation {
    condition = can(regex("^(10\\.(?:25[0-5]|2[0-4][0-9]|1[0-9]{2}|[1-9]?[0-9])\\.(?:25[0-5]|2[0-4][0-9]|1[0-9]{2}|[1-9]?[0-9])\\.(?:25[0-5]|2[0-4][0-9]|1[0-9]{2}|[1-9]?[0-9])|192\\.168\\.(?:25[0-5]|2[0-4][0-9]|1[0-9]{2}|[1-9]?[0-9])\\.(?:25[0-5]|2[0-4][0-9]|1[0-9]{2}|[1-9]?[0-9]))$", var.internal_network))
    error_message = "Provide proper network address for class 10.a.b.c or 192.168.a.b"
  }
}

variable internal_netmask {
  type = string
  default = "/24"
  validation {
    condition = can(regex("^\\/(1[6-9]|2[0-4])$", var.internal_netmask))
    error_message = "Please use mask size from /16 to /24."
  }
}

variable external_network {
  type = string
  default = "10.8.0.0"
  validation {
    condition = can(regex("^(10\\.(?:25[0-5]|2[0-4][0-9]|1[0-9]{2}|[1-9]?[0-9])\\.(?:25[0-5]|2[0-4][0-9]|1[0-9]{2}|[1-9]?[0-9])\\.(?:25[0-5]|2[0-4][0-9]|1[0-9]{2}|[1-9]?[0-9])|192\\.168\\.(?:25[0-5]|2[0-4][0-9]|1[0-9]{2}|[1-9]?[0-9])\\.(?:25[0-5]|2[0-4][0-9]|1[0-9]{2}|[1-9]?[0-9]))$", var.external_network))
    error_message = "Provide proper network address for class 10.a.b.c or 192.168.a.b"
  }
}

variable llm_image {
  type = string
  default = "Ubuntu 22.04 NVIDIA_AI"
}

variable llm_flavor {
  type = string
}

variable llm_api_port {
  type = number
  default = 8765
}

variable llm_tag {
  type = string
}

variable cert_data {
  type = string
  default = "/C=colar_system/ST=earth/L=europe/O=good_people/OU=smart_people/CN=OllamaTest"
}
File 3 - resources.tf
This is the most significant file where definitions of all entities and resources are stored.
resource "random_password" "ollama_api_pass" {
  length           = 24
  special          = true
  min_upper        = 8
  min_lower        = 8
  min_numeric      = 6
  min_special      = 2
  override_special = "-"
  keepers = {
    tenant = var.tenant_project_name
  }
}

output "ollama_api_pass_output" {
  value = random_password.ollama_api_pass.result
  sensitive = true
}

data "openstack_networking_network_v2" "external_network" {
  name = "external"
}

resource "openstack_networking_router_v2" "external_router" {
  name = "${var.env_id}-router"
  external_network_id = data.openstack_networking_network_v2.external_network.id
}

resource "openstack_networking_network_v2" "env_net" {
  name = "${var.env_id}-net"
}

resource "openstack_networking_subnet_v2" "env_net_subnet" {
  name            = "${var.env_id}-net-subnet"
  network_id      = openstack_networking_network_v2.env_net.id
  cidr            = "${var.internal_network}${var.internal_netmask}"
  gateway_ip      = cidrhost("${var.internal_network}${var.internal_netmask}", 1)
  ip_version      = 4
  enable_dhcp     = true
}

resource "openstack_networking_router_interface_v2" "router_interface_external" {
  router_id = openstack_networking_router_v2.external_router.id
  subnet_id = openstack_networking_subnet_v2.env_net_subnet.id
}

resource "openstack_networking_floatingip_v2" "llm_public_ip" {
  pool = "external"
}

resource "openstack_networking_secgroup_v2" "sg_llm_api" {
  name        = "${var.env_id}-sg-llm-api"
  description = "Ollama API"
}

resource "openstack_networking_secgroup_rule_v2" "sg_llm_api_rule_1" {
  direction         = "ingress"
  ethertype         = "IPv4"
  protocol          = "tcp"
  port_range_min    = var.llm_api_port
  port_range_max    = var.llm_api_port
  remote_ip_prefix  = "0.0.0.0/0"
  security_group_id = openstack_networking_secgroup_v2.sg_llm_api.id
}

resource "openstack_compute_instance_v2" "llm_server" {
  name              = "${var.env_id}-server"
  image_name        = var.llm_image
  flavor_name       = var.llm_flavor
  security_groups   = [
    "default",
    "allow_ping_ssh_icmp_rdp",
    openstack_networking_secgroup_v2.sg_llm_api.name
    ]
  key_pair          = var.env_keypair
  depends_on        = [
    openstack_networking_subnet_v2.env_net_subnet
    ]
  user_data = local.llm_vm_user_data
  network {
    uuid = openstack_networking_network_v2.env_net.id
    fixed_ip_v4 = cidrhost("${var.internal_network}${var.internal_netmask}", 3)
  }
}

resource "openstack_compute_floatingip_associate_v2" "llm_ip_associate" {
  floating_ip = openstack_networking_floatingip_v2.llm_public_ip.address
  instance_id = openstack_compute_instance_v2.llm_server.id
}
File 4 - locals.tf
In this file we keep all values recalculated from any type of input data (variables, templates ...).
locals {
  nginx_config = "${templatefile("./llm_api_nginx.conf",
    {
      ollama_api_port = "${var.llm_api_port}"
    }
  )}"
  llm_vm_user_data = "${templatefile("./llm_vm_user_data.yaml",
    {
      llm_tag = "${var.llm_tag}"
      cert_data = "${var.cert_data}"
      ollama_api_pass = "${random_password.ollama_api_pass.result}"
      nginx_config_content = "${indent(6, local.nginx_config)}"
    }
  )}"
}
File 5 - llm_vm_user_data.yaml
This is a template of user-data that would be injected into our instance hosting Ollama.
#cloud-config
package_update: true
package_upgrade: true
packages:
  - vim
  - openssh-server
  - nginx
  - apache2-utils
write_files:
  - path: /etc/nginx/nginx.conf
    permissions: '0700'
    content: |
      ${nginx_config_content}
  - path: /run/scripts/prepare_llm_vm
    permissions: '0700'
    defer: true
    content: |
      #!/bin/bash
      curl -fsSL https://ollama.com/install.sh | sh
      sleep 5s
      systemctl enable ollama.service
      systemctl start ollama.service
      sleep 5s
      export HOME=/root
      ollama pull ${llm_tag}
      sudo openssl req -x509 -nodes -days 365 -newkey rsa:4096 -keyout /etc/ssl/private/ollama_api.key -out /etc/ssl/certs/ollama_api.crt -subj "${cert_data}"
      sudo htpasswd -b -c /etc/.htpasswd ollama ${ollama_api_pass}
      systemctl enable nginx
      systemctl start nginx
      echo 'Ollama ready!' > /var/log/ollama_ready.log
runcmd:
  - ["/bin/bash", "/run/scripts/prepare_llm_vm"]
File 5 - llm_vm.tfvars
In this file, we will provide values for Terraform variables:
- os_user_name - Enter your username used to authenticate in CREODIAS here.
- tenant_project_name - Name of the project selected or created in step 1.
- os_application_credential_id
- os_application_credential_secret
- region - CloudFerro Cloud region name. Allowed values are: WAW3-1, WAW3-2, FRA1-2, WAW4-1.
- env_id - Name that will prefix all resources created in OpenStack.
- env_keypair - Keypair available in OpenStack. You will use it to log in via SSH to the LLM machine if this would be necessary - For example to use model directly with
ollama run MODEL_TAGcommand. - internal_network - Network class for our environment. Any of 10.a.b.c or 192.168.b.c.
- internal_netmask - Network mask. Allowed values: /24, /16.
- llm_flavor - VM flavor for our Ollama host.
- llm_image - Operating system image to be deployed on our instance.
- llm_tag - Tag from Ollama Library of model that we want automatically download during provisioning.
- cert_data - Values for self signed certificate.
Some of the included data, such as credentials, are sensitive. So if you save this in a Git repository, it is strongly recommended to add the file pattern "*.tfvars" to ".gitignore".
You may also add to this file the variable "external_network".
Do not forget to fill or update variable values in the content below.
os_user_name = "user@domain"
tenant_project_name = "cloud_aaaaa_b"
os_application_credential_id = "enter_ac_id_here"
os_application_credential_secret = "enter_ac_secret_here"
region = ""
env_id = ""
env_keypair = ""
internal_network = "192.168.1.0"
internal_netmask = "/24"
llm_flavor = "vm.a6000.8"
llm_image = "Ubuntu 22.04 NVIDIA_AI"
llm_tag="llama3.2:1b"
cert_data = "/C=PL/ST=Mazowieckie/L=Warsaw/O=CloudFerro/OU=Tech/CN=OllamaTest"
Step 5 - Activate Terraform Workspace
A very useful Terraform functionality is workspaces. Using workspaces, you may manage multiple environments with the same code.
Create and enter a directory for our project by executing commands:
mkdir tf_llm
cd tf_llm
To initialize Terraform, execute:
terraform initThen, check workspaces:
terraform workspace listAs an output of the command above, you should see output like this:
* defaultAs we want to use a dedicated workspace for our environment, we must create it. To do this, please execute the command:
terraform workspace new llm_vmTerraform will create a new workspace and switch to it.
Step 6 - Validate Configuration
To ensure the prepared configuration is valid, do two things.
First, execute the command:
terraform validateThen execute Terraform plan:
terraform plan -var-file=llm_vm.tfvarsYou should get as an output a list of messages describing resources that would be created.
Step 7 - Provisioning of Resources
To provision all the resources, execute the command:
terraform apply -var-file=llm_vm.tfvarsAs with the plan command, you should get as an output a list of messages describing resources that would be created, but now finished with a question if you want to apply changes.
You must answer with the full word "yes".
You will see a sequence of messages about the status of provisioning.
Please remember that when the above sequence successfully finishes, the Ollama host is still not ready!
A script configuring the Ollama and downloading selected model is still running on the instance.
The process may take several minutes.
We recommend waiting about 5 minutes.
Step 8 - Obtaining VM IP and basic authorization password
To obtain a public IP address of the created instance, use the following command:
terraform state show openstack_networking_floatingip_v2.llm_public_ipPublic IP of host will be in field "address"
Password to authorize may be displayed by command:
terraform output -jsonPassword text will be at the key "value".
Step 9 - Testing
You may use use LLM directly after accessing the created instance with SSH.
ssh -i ENV_KEY_PAIR eouser@LLM_VM_PUBLIC_IPThen:
ollama run llama3.2:1bIf the instance is accessed from some application via API than, API Test may be done using similar Curl request as previously:
curl -k -u "ollama:GENERATED_PASSWORD" https://PUBLIC_IP:8765/api/generate -d '{
  "model": "llama3.2:1b",
  "prompt": "Who is Peter Watts?"
}'
Step 10 - Removing resources when they are not needed
As GPU instance is more expensive we may completely remove it when it is not needed. By executing the command below you remove only the VM instance. The rest of resources would not be affected.
terraform destroy -var-file=llm_vm.tfvars -target=openstack_compute_instance_v2.llm_serverYou may recreate it simply by running:
terraform apply -var-file=llm_vm.tfvarsStep 11 - Usage
That's all! You may use the created virtual machine with GPU and LLM of your choice.
Happy prompting with your own AI 🙂
How to use CloudFerro AI Hub Sherlock
by Mateusz Ślaski, Sales Support Engineer, and Jan Szypulski, Product Manager, CloudFerro
Introduction
CloudFerro Sherlock service is a managed Generative AI platform designed to empower organizations with advanced artificial intelligence capabilities without the complexity of managing infrastructure. Here are the key features and benefits of the Sherlock service:
- Sherlock offers access to a curated selection of cutting-edge language models, including models such as:
- Llama 3.1 and 3.3
- Mistral AI
- Bielik
- PLLuM
- DeepSeek
- The platform provides OpenAI-compatible endpoints, allowing seamless integration with existing solutions by simply replacing a few lines of code in the OpenAI library.
- Sherlock prioritizes data security and privacy, operating within a Polish data center. It adheres to a strict no-training policy, meaning user data is not stored or used for model training. The CloudFerro platform is ISO 27001 and ISO 9001 certified, ensuring high standards of security and quality management.
- The service is built on enterprise-ready infrastructure, eliminating the need for organizations to invest in and manage their own IT infrastructure. It utilizes powerful GPU processors for high-performance computing.
- With Sherlock Your organization can quickly integrate advanced AI models into your applications without complex technical overhead.
- Sherlock offers a usage-based billing model with a pay-per-token pricing structure, providing granular cost control and transparent pricing.
- The platform is part of a larger Cloud services ecosystem consisting of compute, storage and access to the Earth Observation data repository. All hosted and managed in the EU.
Overall, CloudFerro AI platform is designed to support businesses in leveraging AI for innovation while ensuring high security and privacy standards.
Sherlock platform has brief but essential documentation available at https://docs.sherlock.cloudferro.com/docs/introduction/.
General CloudFerro cloud documentation is available at https://docs.cloudferro.com/en/latest/index.html.
Agenda
In this guide you will get a list of ready-to-use applications providing GUI for LLMs, and then you will learn how to:
- register at CloudFerro cloud
- set up CF Sherlock AI Project
- generate API Key
- connect selected desktop AI GUI application to Sherlock
Selecting LLM desktop GUI applications
To communicate with LLM you may use various desktop applications.
Here is the list of some selected.
- Ollama: Features: open source, allows downloading, managing, and running LLMs locally. Offers both command-line and graphical interfaces, compatible with macOS, Linux, and Windows.
- AnythingLLM: Features: open source, multi-modal support, integrates with various LLMs and vector databases. Offers multi-user support, customizable chat widgets, and supports multiple document formats.
- Jan: Features: open source, allows running models like Mistral and Llama offline. Supports importing models from Hugging Face and accessing models via OpenAI compatible API.
- LM Studio: Features: Simple interface for finding, downloading, and running models from Hugging Face. Mimics OpenAI’s API for easy integration.
With some research you can find other similar applications and with some analysis taking into consideration your business needs you will choose the one.
For the purpose of this guide, we choose Jan application as it is Open Source software, it has versions for MacOS as Linux and for Windows. Additionally, and they state that are focused on privacy.
Registering in CloudFerro cloud
To use Sherlock’s API, you need to be an admin user of an Organization registered at the CloudFerro Cloud.
A detailed process of registration is described in this article Registration and Setting up an Account.
Remember to set up your organization, as well. You can read how to do it in the article Adding and editing Organization.
Once you are ready, you will be able to create your first project.
Project creation
To generate API key go to Sherlock Control Panel.
You will see empty "List of projects".
Fill the text entry box below “Create new project” label with a name and press the button “Create”.

Authentication
Sherlock by CloudFerro uses API keys for authentication. You can create API keys within the created project in your Control Panel.
To generate API key, go to Sherlock Control Panel.
You should see the project created in the previous step:

Click “Details” to open a view for the selected project.
In Sherlock management panel, the API_KEY is called “service key”. Please scroll the view down. You will see the section dedicated to creating keys.

Enter a name for your key and press “Create” button.
You will get the following panel.
Click “Copy” to get key value.
Than save it in a secure location as Password Manager application or service.

Remember that your API key is secret! Do not share it with others or expose it in any client-side code (browsers, apps). Production requests must be routed through your own backend server where your API key can be securely loaded from an environment variable or key management service.
Finding endpoints that will be used in Chat GUI application
Please open Sherlock documentation Models Endpoint. You will see example Python code and example CURL execution.
Please note the following url: https://api-sherlock.cloudferro.com/openai/v1/models
Please open Sherlock documentation Chat Completion Endpoint.
You will see example Python code and example CURL execution.
In this case CURL execution contains the exact link that we are interested in. Url to note is:
GUI installation
Go to Jan application homepage and download version for your platform. Then, follow the platform related instructions.
When application starts, you will see the window:

To use CloudFerro Sherlock in Jan, you must install a remote engine. Select the hamburger menu just beside the hand icon “☰” then select “Jan” and “Settings”.

Select “Engines” on the left side bar.

Then press “+ Install Engine” button.

You will see the following window:

On this screenshot there are all fields with the data collected in the previous steps:
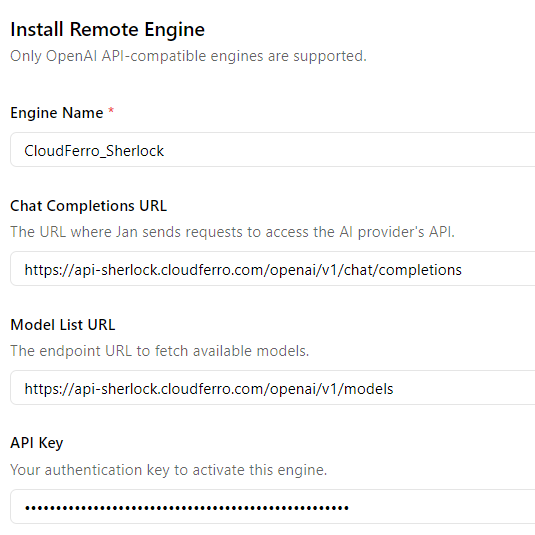
Scroll the window to the bottom and press “Install button”.

Click speech bubble icon “🗩” on the left side. You will see the “New Thread” window.

Click “Select a model” at the bottom.
You will see CloudFerro Sherlock.

Expand the available models list by clicking“˅” arrow.

Select the model that you want to use.
For this guide, I selected Llama-3.3.
Type your prompt in the field titled “Ask me anything”.
For example, if you enter:
Generate Python "Hello World!" program.
you will receive an answer with the corresponding code:

When you go to Sherlock Billing summary, you will see tokens spent on your conversations.

Summary and further steps
You are now able to set up and use the CloudFerro Sherlock platform with the GUI application (Jan or others after adapting this procedure). You can test hosted models with your data without worrying about its privacy.
In the Sherlock documentation you will find more examples, especially how to use the models with Python code and integrate them with your applications.
Happy prompting!
Explore Sherlock platform
Discover a fully managed Generative AI platform with OpenAI-compatible endpoints, enabling seamless integration of advanced AI capabilities into your applications. Access high-performing language models through a unified API, eliminating the complexity of infrastructure management and model operations.
How to run OpenVPN from Terraform Code
by Mateusz Ślaski, Sales Support Engineer, CloudFerro
The following article covers the subject of creating an OpenVPN instance allowing secure access to the OpenStack network through a VPN tunnel.
We will build step-by-step code containing templates for:
- network for our environment
- necessary security group with rules
- virtual machine instance with automatically configured VPN
- dedicated Object Storage for VPN configuration persistence
Instructions and the way of executing are defined in a way that allows you to learn, by the way, some Terraform and OpenStack functions such as:
- splitting TF code into multiple files
- using TF Workspaces
- using TF templates
- launching instances configured with Cloud-Init as TF and OpenStack "user-data"
Prerequisites / Preparation
Before you start, please read the documents:
- Generating and Authorizing Terraform using a Keycloak User on CREODIAS
- How to Generate or Use Application Credentials via CLI on CREODIAS: We will use them to authenticate the Terraform OpenStack provider.
- Additionally, you may review:
You may also, if necessary, refresh some details about the manual management of: projects, key-pairs, networks, and security groups:
- https://creodias.docs.cloudferro.com/en/latest/networking/Generating-a-SSH-keypair-in-Linux-on-Creodias.html
- https://creodias.docs.cloudferro.com/en/latest/cloud/How-to-create-key-pair-in-OpenStack-Dashboard-on-Creodias.html
- https://creodias.docs.cloudferro.com/en/latest/networking/How-to-Import-SSH-Public-Key-to-OpenStack-Horizon-on-Creodias.html
- https://creodias.docs.cloudferro.com/en/latest/cloud/How-to-use-Security-Groups-in-Horizon-on-Creodias.html
- https://creodias.docs.cloudferro.com/en/latest/networking/How-to-create-a-network-with-router-in-Horizon-Dashboard-on-Creodias.html
Step 1 - Select or create project
You may use the default project in your tenant (usually named "cloud_aaaaa_bb") or create a new one by following the document mentioned below.
Step 2 - Install Terraform
There are various ways to install Terraform, some of which are described in the documentation mentioned in the "Preparation" chapter.
If you are using Ubuntu 22.04 LTS or newer and you do not need the latest Terraform release (for the Terraform OpenStack provider, it is not necessary), the easiest way is to use Snap.
First, install Snap
sudo apt install snapdThen install Terraform
sudo snap install terraform --classicStep 3 - Allowing access to project from Terraform
Now create Application Credentials.
Please follow the mentioned document: "How to Generate or Use Application Credentials via CLI on CREODIAS": https://creodias.docs.cloudferro.com/en/latest/cloud/How-to-generate-or-use-Application-Credentials-via-CLI-on-Creodias.html
When you have them ready, save them in a secure location (i.e., password manager) and fill in the variables in the "my_first_vpn.tfvars" file.
Step 4 - Prepare configuration files
As Terraform operates on the entire directory and automatically merges all "*.tf" files into one codebase, we may split our Terraform code into a few files to manage the code more easily.
- main.tf
- variables.tf
- resources.tf
Additionally, we need two other files:
- open_vpn_user_data.yaml
- my_first_vpn.tfvars
File 1 - main.tf
In this file, we keep the main definitions for Terraform and the OpenStack provider.
terraform {
  required_version = ">= 0.14.0"
  required_providers {
    openstack = {
      source  = "terraform-provider-openstack/openstack"
      version = "~> 1.51.1"
    }
  }
}

provider "openstack" {
  auth_url    = var.auth_url
  region      = var.region
  user_name =  "${var.os_user_name}"
  application_credential_id = "${var.os_application_credential_id}"
  application_credential_secret = "${var.os_application_credential_secret}"
}

data "openstack_networking_router_v2" "external_router" {
  name = "${var.tenant_project_name}"
}
File 2 - variables.tf
In this file, we will keep variable definitions.
# Section provideing data necessary to connect and authenticate to OpenStack
variable os_user_name {
  type = string
}

variable tenant_project_name {
  type = string
}

variable os_application_credential_id {
  type = string
}

variable os_application_credential_secret {
  type = string
}

variable "auth_url" {
  type = string
  default = "https://keystone.cloudferro.com:5000"
}

variable "region" {
  type = string
  validation {
    condition = contains(["WAW3-1", "WAW3-2", "FRA1", "FRA1-2", "WAW4-1"], var.region)
    error_message = "Proper region names are: WAW3-1, WAW3-2, FRA1, FRA1-2, WAW4-1"
  }
}

#Our friendly name for entire environment.
variable "env_id" {
  type = string
}

# Key-pair created in previous steps
variable env_keypair {
  type = string
}

variable internal_network {
  type = string
  default = "192.168.11.0"
  validation {
    condition = can(regex("^(10\\.(?:25[0-5]|2[0-4][0-9]|1[0-9]{2}|[1-9]?[0-9])\\.(?:25[0-5]|2[0-4][0-9]|1[0-9]{2}|[1-9]?[0-9])\\.(?:25[0-5]|2[0-4][0-9]|1[0-9]{2}|[1-9]?[0-9])|192\\.168\\.(?:25[0-5]|2[0-4][0-9]|1[0-9]{2}|[1-9]?[0-9])\\.(?:25[0-5]|2[0-4][0-9]|1[0-9]{2}|[1-9]?[0-9]))$", var.internal_network))
    error_message = "Provide proper network address for class 10.a.b.c or 192.168.a.b"
  }
}

variable internal_netmask {
  type = string
  default = "/24"
  validation {
    condition = can(regex("^\\/(1[6-9]|2[0-4])$", var.internal_netmask))
    error_message = "Please use mask size from /16 to /24."
  }
}

variable external_network {
  type = string
  default = "10.8.0.0"
  validation {
    condition = can(regex("^(10\\.(?:25[0-5]|2[0-4][0-9]|1[0-9]{2}|[1-9]?[0-9])\\.(?:25[0-5]|2[0-4][0-9]|1[0-9]{2}|[1-9]?[0-9])\\.(?:25[0-5]|2[0-4][0-9]|1[0-9]{2}|[1-9]?[0-9])|192\\.168\\.(?:25[0-5]|2[0-4][0-9]|1[0-9]{2}|[1-9]?[0-9])\\.(?:25[0-5]|2[0-4][0-9]|1[0-9]{2}|[1-9]?[0-9]))$", var.external_network))
    error_message = "Provide proper network address for class 10.a.b.c or 192.168.a.b"
  }
}

variable "vpn_image" {
  type = string
  default = "Ubuntu 22.04 LTS"
}

variable "vpn_version" {
  type = string
}

variable "vpn_flavor" {
  type = string
  default = "eo2a.xlarge"
}

variable cert_country {
  type = string
}

variable cert_province {
  type = string
}

variable cert_city {
  type = string
}

variable cert_org {
  type = string
}

variable cert_email {
  type = string
}

variable cert_orgunit {
  type = string
}
File 3 - resources.tf
This is the most significant file where definitions of all entities and resources are stored.
resource "random_password" "password" {
  length           = 24
  special          = true
  min_upper        = 8
  min_lower        = 8
  min_numeric      = 6
  min_special      = 2
  override_special = "-"
  keepers = {
    tenant = var.tenant_project_name
  }
}

resource "openstack_identity_ec2_credential_v3" "object_storage_ec2_key" {
  region = var.region
}

resource "openstack_objectstorage_container_v1" "backup_repo" {
  name = "${var.env_id}-vpnaac-backup"
  region = var.region
}

resource "openstack_networking_secgroup_v2" "sg_openvpn" {
  name        = "${var.env_id}-sg-openvpn"
  description = "OpenVPN UDP port"
}

resource "openstack_networking_secgroup_rule_v2" "sg_openvpn_rule_1" {
  direction         = "ingress"
  ethertype         = "IPv4"
  protocol          = "udp"
  port_range_min    = 1194
  port_range_max    = 1194
  remote_ip_prefix  = "0.0.0.0/0"
  security_group_id = openstack_networking_secgroup_v2.sg_openvpn.id
}

data "openstack_networking_router_v2" "project-external-router" {
  name = "${var.tenant_project_name}"
}

resource "openstack_networking_network_v2" "env_net" {
  name = "${var.env_id}-net"
}

resource "openstack_networking_subnet_v2" "env_net_subnet" {
  name            = "${var.env_id}-net-subnet"
  network_id      = openstack_networking_network_v2.env_net.id
  cidr            = "${var.internal_network}${var.internal_netmask}"
  gateway_ip      = cidrhost("${var.internal_network}${var.internal_netmask}", 1)
  ip_version      = 4
  enable_dhcp     = true
}

resource "openstack_networking_router_interface_v2" "router_interface_external" {
  router_id = data.openstack_networking_router_v2.external_router.id
  subnet_id = openstack_networking_subnet_v2.env_net_subnet.id
}

resource "openstack_networking_floatingip_v2" "vpn_public_ip" {
  pool = "external"
}

resource "openstack_compute_instance_v2" "vpn_server" {
  name              = "${var.env_id}-vpn-server"
  image_name        = "Ubuntu 22.04 LTS"
  flavor_name       = var.vpn_flavor
  security_groups   = [
    "default",
    "allow_ping_ssh_icmp_rdp",
    openstack_networking_secgroup_v2.sg_openvpn.name
    ]
  key_pair          = var.env_keypair
  depends_on        = [
    openstack_networking_subnet_v2.env_net_subnet
    ]
  user_data = "${templatefile("./vpn_user_data.yaml",
    {
      env_id = "${var.env_id}"
      region_name = "${var.region}"
      archive_url =  "${join("", ["https://s3.", lower(var.region), ".cloudferro.com"])}"
      archive_name = "${openstack_objectstorage_container_v1.backup_repo.name}"
      archive_access = "${openstack_identity_ec2_credential_v3.object_storage_ec2_key.access}"
      archive_secret = "${openstack_identity_ec2_credential_v3.object_storage_ec2_key.secret}"
      vpn_version = "${var.vpn_version}"
      vpn_net_external = "${var.external_network}"
      vpn_net_internal = "${var.internal_network}"
      vpn_net_internal_mask = "${cidrnetmask("${var.internal_network}${var.internal_netmask}")}"
      vpn_public_ip = "${openstack_networking_floatingip_v2.vpn_public_ip.address}"
      cert_pass = "${random_password.password.result}"
      cert_country = "${var.cert_country}"
      cert_province = "${var.cert_province}"
      cert_city = "${var.cert_city}"
      cert_org = "${var.cert_org}"
      cert_email = "${var.cert_email}"
      cert_orgunit = "${var.cert_orgunit}"
    }
  )}"
  network {
    uuid = openstack_networking_network_v2.env_net.id
    fixed_ip_v4 = cidrhost("${var.internal_network}${var.internal_netmask}", 3)
  }
}

resource "openstack_compute_floatingip_associate_v2" "vpn_ip_associate" {
  floating_ip = openstack_networking_floatingip_v2.vpn_public_ip.address
  instance_id = openstack_compute_instance_v2.vpn_server.id
}
File 4 - vpn_user_data.yaml
This is a template of user-data that would be injected into our VPN instance. This file contains configuration and package installation directives and a script responsible for VPN configuration.
#cloud-config
package_update: true
package_upgrade: true
packages:
  - openssh-server
  - openvpn
  - easy-rsa
  - iptables

write_files:
  - path: /run/scripts/prepare_vpn
    permissions: '0700'
    content: |
      #!/bin/bash
      echo "${archive_access}:${archive_secret}" > /home/eouser/.passwd-s3fs-archive
      chmod 600 /home/eouser/.passwd-s3fs-archive
      REPO_NAME=${archive_name}
      if ! [[ -z "$REPO_NAME" ]]
      then
        mkdir /mnt/archive
        echo "/usr/local/bin/s3fs#$REPO_NAME /mnt/archive fuse passwd_file=/home/eouser/.passwd-s3fs-repo,_netdev,allow_other,use_path_request_style,uid=0,umask=0000,mp_umask=0000,gid=0,url=${archive_url},endpoint=default 0 0" >> /etc/fstab
        mount /mnt/repo
      fi
      ENV_ID="${env_id}"
      CLIENT_NAME="client-$ENV_ID"
      VPN_BACKUP=/mnt/archive/openvpn-backup-$ENV_ID.tar
      VPN_VERSION=`cat /mnt/archive/$ENV_ID-vpn-version`
      if [[ -f $VPN_BACKUP ]] && [[ "$VPN_VERSION" = "${vpn_version}" ]]
      then
        tar xf $VPN_BACKUP -C /etc openvpn
        tar xf $VPN_BACKUP -C /home/eouser $CLIENT_NAME.ovpn
      else
      # ---- Server cerificates preparation
      make-cadir /etc/openvpn/$ENV_ID-easy-rsa
      cd /etc/openvpn/$ENV_ID-easy-rsa
      echo "set_var EASYRSA_REQ_COUNTRY    \"${cert_country}\"" >> ./vars
      echo "set_var EASYRSA_REQ_PROVINCE   \"${cert_province}\"" >> ./vars
      echo "set_var EASYRSA_REQ_CITY       \"${cert_city}\"" >> ./vars
      echo "set_var EASYRSA_REQ_ORG        \"${cert_org}\"" >> ./vars
      echo "set_var EASYRSA_REQ_EMAIL      \"${cert_email}\"" >> ./vars
      echo "set_var EASYRSA_REQ_OU         \"${cert_orgunit}\"" >> ./vars
      ./easyrsa init-pki
      CERT_PASS="${cert_pass}"
      (echo "$CERT_PASS"; echo "$CERT_PASS"; echo "$ENV_ID-vpn") | ./easyrsa build-ca
      SRV_NAME="server-$ENV_ID"
      (echo $SRV_NAME) | ./easyrsa gen-req $SRV_NAME nopass
      ./easyrsa gen-dh
      # (echo "yes"; echo "$CERT_PASS"; echo "$CERT_PASS") | ./easyrsa sign-req server $SRV_NAME
      (echo "yes"; echo "$CERT_PASS") | ./easyrsa sign-req server $SRV_NAME
      cp /etc/openvpn/$ENV_ID-easy-rsa/pki/dh.pem /etc/openvpn/
      cp /etc/openvpn/$ENV_ID-easy-rsa/pki/ca.crt /etc/openvpn/
      cp /etc/openvpn/$ENV_ID-easy-rsa/pki/issued/$SRV_NAME.crt /etc/openvpn/
      cp /etc/openvpn/$ENV_ID-easy-rsa/pki/private/$SRV_NAME.key /etc/openvpn/
      # ---- Client certificates
      (echo $CLIENT_NAME) | ./easyrsa gen-req $CLIENT_NAME nopass
      # (echo "yes"; echo "$CERT_PASS"; echo "$CERT_PASS") | ./easyrsa sign-req client $CLIENT_NAME
      (echo "yes"; echo "$CERT_PASS") | ./easyrsa sign-req client $CLIENT_NAME
      CA_CLIENT_CONTENT=`cat /etc/openvpn/$ENV_ID-easy-rsa/pki/ca.crt`
      CRT_CLIENT_CONTENT=`cat /etc/openvpn/$ENV_ID-easy-rsa/pki/issued/$CLIENT_NAME.crt`
      KEY_CLIENT_CONTENT=`cat /etc/openvpn/$ENV_ID-easy-rsa/pki/private/$CLIENT_NAME.key`
      cd /etc/openvpn/
      openvpn --genkey secret ta.key
      TA_CLIENT_CONTENT=`cat /etc/openvpn/ta.key`
      # ---- Server configuration
      TMP_SRV_CONF="/home/eouser/$SRV_NAME.conf"
      SRV_CONF="/etc/openvpn/$SRV_NAME.conf"
      cat <<EOF > $TMP_SRV_CONF
      port 1194
      dev tun
      ca ca.crt
      cert $SRV_NAME.crt
      key $SRV_NAME.key
      dh dh.pem
      server ${vpn_net_external} 255.255.255.0
      push "route ${vpn_net_internal} ${vpn_net_internal_mask}"
      ifconfig-pool-persist /var/log/openvpn/ipp.txt
      duplicate-cn
      keepalive 10 120
      tls-auth ta.key 0
      cipher AES-256-CBC
      persist-key
      persist-tun
      status /var/log/openvpn/openvpn-status.log
      verb 3
      explicit-exit-notify 1
      EOF
      cp $TMP_SRV_CONF $SRV_CONF
      rm $TMP_SRV_CONF
      # --- Client config generation ---
      CLIENT_CONF="/home/eouser/$CLIENT_NAME.ovpn"
      cat <<EOF > $CLIENT_CONF
      client
      dev tun
      proto udp
      remote ${vpn_public_ip} 1194
      resolv-retry infinite
      nobind
      persist-key
      persist-tun
      remote-cert-tls server
      tls-auth ta.key 1
      key-direction 1
      cipher AES-256-CBC
      verb 3
      <ca>
      $CA_CLIENT_CONTENT
      </ca>
      <cert>
      $CRT_CLIENT_CONTENT
      </cert>
      <key>
      $KEY_CLIENT_CONTENT
      </key>
      <tls-auth>
      $TA_CLIENT_CONTENT
      </tls-auth>
      EOF
      chown eouser.eouser $CLIENT_CONF
      # Backup config to archive
      tar cf $VPN_BACKUP -C /etc openvpn
      tar rf $VPN_BACKUP -C /home/eouser $CLIENT_NAME.ovpn
      echo ${vpn_version} > /mnt/archive/$ENV_ID-vpn-version
      fi
      echo "net.ipv4.ip_forward=1" >> /etc/sysctl.conf
      sysctl -p
      cat <<EOF > /etc/systemd/system/iptables_nat.service
      [Unit]
      Requires=network-online.target
      [Service]
      Type=simple
      ExecStart=iptables -t nat -A POSTROUTING -s ${vpn_net_external}/24 -o eth0 -j MASQUERADE
      [Install]
      WantedBy=multi-user.target
      EOF
      systemctl enable iptables_nat.service
      systemctl start iptables_nat.service
      systemctl start openvpn@$SRV_NAME
      systemctl enable openvpn@$SRV_NAME
      date > /home/eouser/server_ready.txt
runcmd:
  - ["/bin/bash", "/run/scripts/prepare_vpn"]
File 5 - my_first_vpn.tfvars
In this file we will provide values of Terraform variables
- os_user_name - Enter your username used to authenticate in CREODIAS here.
- tenant_project_name - Name of the project selected or created in step 1.
- os_application_credential_id
- os_application_credential_secret
- region - CloudFerro Cloud region name. Allowed values are: WAW3-1, WAW3-2, FRA1-2, WAW4-1.
- env_id - Name that will prefix all resources created in OpenStack.
- vpn_keypair - Keypair available in OpenStack. You will use it to log in via SSH to the VPN machine to get the Client configuration file.
- network - Network class for our environment. Any of 10.a.b.c or 192.168.b.c.
- netmask - Network mask. Allowed values: /24, /16.
- vpn_flavor - VM flavor for our VPN.
- vpn_version - It may be any string. If this value doesn't change, then recreating the VPN instance will download the backup configuration from the object archive, and users may still connect with the VPN client config file. However, if you change this variable and reapply Terraform on your environment, the VPN configuration will be recreated, and a new VPN client configuration file has to be delivered to users.
Some of the included data, such as credentials, are sensitive. So if you save this in a Git repository, it is strongly recommended to add the file pattern "*.tfvars" to ".gitignore".
You may also add to this file the variable "external_network" however.
Do not forget to fill or update variable values in the content below.
os_user_name = "user@domain"
tenant_project_name = "cloud_aaaaa_b"
os_application_credential_id = "enter_ac_id_here"
os_application_credential_secret = "enter_ac_secret_here"
region = ""
env_id = ""
env_keypair = ""
internal_network = "192.168.1.0"
internal_netmask = "/24"
external_network = "10.8.0.0"
vpn_flavor = "eo2a.large"
vpn_version = "1"
cert_country = ""
cert_city = ""
cert_province = ""
cert_org = ""
cert_orgunit = ""
cert_email = ""
Files listed above except "my_first_vpn.tfvars" will be available in the CloudFerro GitHub repository.
Step 5 - Activate Terraform workspace
A very useful Terraform functionality is workspaces. Using workspaces, you may manage multiple environments with the same code.
Create and enter a directory for our project by executing commands:
mkdir tf_vpn cd tf_vpnTo initialize Terraform, execute:
terraform initThen, check workspaces:
terraform workspace listAs an output of the command above, you should see output like this:
* defaultAs we want to use a dedicated workspace for our environment, we must create it. To do this, please execute the command:
terraform workspace new my_first_vpnTerraform will create a new workspace and switch to it.
Step 6 - Validate configuration
To ensure the prepared configuration is valid, do two things.
First, execute the command:
terraform validateThen execute Terraform plan:
terraform plan -var-file=my_first_vpn.tfvarsYou should get as an output a list of messages describing resources that would be created.
Step 7 - Provisioning of resources
To provision all resources, execute the command:
terraform apply -var-file=my_first_vpn.tfvarsAs with the plan command, you should get as an output a list of messages describing resources that would be created, but now finished with a question if you want to apply changes.
You must answer with the full word "yes".
You will see a sequence of messages about the status of provisioning.
Please remember that when the above sequence successfully finishes, the VPN is still not ready!
A script configuring the VPN is still running on the VPN server.
The process of automatically signing certificates with the easy-rsa package may take several minutes.
We recommend waiting about 5 minutes.
Step 8 - Obtaining VPN Client Configuration File
First, you have to find the public IP address of the created VPN server.
You may check it in the OpenStack Horizon GUI or use the OpenStack CLI command `openstack server list`. But if Terraform is at hand, then use it and execute: terraform state show openstack_networking_floatingip_v2.vpn_public_ip
In the command output, look for the row with "address".
Test the connection to the VPN server by executing the command:
ssh -i .ssh/PRV_KEY eouser@VPN_SRV_IPYou will be asked to confirm the server fingerprint. Type "yes".
When you successfully get a connection, check if the VPN was automatically configured.
Execute the command:
ls -lYou should see two files:
- client-ENV_ID.ovpn - Contains client configuration with all necessary keys and certificates.
- server_ready.txt - Contains the date and time when the configuration script finished its work.
Logout by typing:
exitAnd copy the configuration file to your computer by executing:
scp -i .ssh/PRV_KEY eouser@VPN_SRV_IP:/home/eouser/client-ENV_ID.ovpnStep 9 - Configure OpenVPN Client to Test Connection
Create an Ubuntu instance in another project, or in another region.
Associate an FIP to it.
Log in with SSH.
And install OpenVPN:
sudo apt install openvpnExit this instance and copy the client configuration file by executing:
scp -i .ssh/PRIV_KEY client-ENV_ID.ovpn eouser@CLIENT_IP:/home/eouserLog in to this instance again and execute:
sudo cp client-vpnaas.ovpn /etc/openvpn/client.conf cd /etc/openvpn sudo openvpn --config client.confYou should see a sequence of log messages finished with "Initialization Sequence Completed". If you connect to this machine with another terminal and execute:
ip aYou should see 3 network interfaces:
- lo
- eth0
- tun0
Return to terminal where test session of OpenVPN was started. Stop it by pressing "Ctr+C".
To make VPN connection persistent execute:
sudo systemctl enable openvpn@client
sudo systemctl start openvpn@client
That is all. From this moment, you may access any resources within the created network via the VPN tunnel.
Some remarks and possible improvements:
- Obtained client file may be used also on Windows computers. To connect them. Download community OpenVPN client from https://openvpn.net/community-downloads/ and import this file.
- Proposed configuration allow to connect separate computers to single VPN server. If you need bridge connection network to network, then please check OpenVPN documentation to tune this solution.
- All client computers connected use the same certificates and keys to connect. If you need user based access end client identification than also please tune it to your needs.
Why Spot instances make cloud computing more sustainable
by Mateusz Ślaski, Sales Support Engineer, CloudFerro
Making any industry sustainable and more environmentally friendly involves minimizing its influence on the entire environment by:
- Reducing environmental degradation by mining or extracting fuels as resources to build power plants.
- Decreasing:
- CO2 emissions
- Water consumption
- Pollution
- Ground coverage by installations.
Power consumption
In the cloud industry, we can optimize power consumption in data centers where cloud infrastructure is located. There are many ways to cut down data centers’ power consumption.
Some important examples are:
- Reduction of losses in power infrastructure thanks to:
- Better efficiency components.
- Shorter power cables.
- Location closer to power plants.
- Improving cooling:
- No mixing of cold and hot air by blanking panels and other ways to force proper airflow through components.
- Proper cable management not to disturb the airflow.
- Using liquid cooling.
- Using controlled variable speed fans.
- Using heat-proof components that allow operating at higher temperatures.
- Air-side and water-side economizers.
- Humidity management.
- Waste heat recovery.
- Hardware optimization:
- Storage tiers (low performance components for less frequently accessed data, high performance components for frequently accessed data).
- Use low-energy consumption components.
- Power consumption monitoring and switching off unused components.
- Consolidate infrastructure and maximize hardware usage over time.
... and many more not mentioned here.
Resources consumption
Building and equipping data centers involves an entire range of technologies that include:
- Ground preparation.
- Building construction.
- Road construction.
- Power infrastructure.
- Telecommunication infrastructure.
- Heating, Ventilation, and Air Conditioning (HVAC).
- Water and sewage installations.
- Computer equipment.
Building Power Plants, including renewable ones, such as wind turbines and solar, involves a similar range of environmental impacts.
Savings
Taking into consideration all these aspects, it seems that an eco-friendly data center would be an installation that involves as few resources and energy as possible, used completely. Then, we focus on the last point "Consolidate infrastructure and maximize hardware usage over time" because:
Fewer physical servers in a data center means:
- No resources and energy consumed to manufacture those devices.
- Reduction of space of the Data Center and resources and energy consumed for DC construction.
- Lower maintenance cost.
- Significant power consumption reduction.
In contrast to other resources, computing power in many cases may be consumed 24/7, therefore many cases of time-consuming calculations may be scheduled and batch-executed outside standard working hours. A smaller data center utilized all the time near its 100% safe capacity in the long term will have a lower environmental impact than a bigger one that is used only partially but requires to be powered 24/7.
Solution – spot instances
However, good will is not enough to change businesses to operate in this way. It is necessary to invest time to identify workloads that can be executed in this way and to develop procedures on how to execute and maintain such calculations. The best way to encourage customers to adopt such practices is to provide significantly lower prices for computing resources.
Here come spot instances as “knights on white horses”. Spot virtual machines are:
- Significantly cheaper.
- Do not lock resources for more demanding customers or critical services.
Spot instances - gains and challenges
- For cloud operators, the gains from spot VMs include:
- Lower investments in hardware.
- Lower cost of server room lease or maintenance.
- More predictable infrastructure load allowing, for example, better agreements with power network operators.
The challenges that cloud operators may face are:
- Lower SPOT prices bring lower income.
- Shorter service windows.
- Single failures may strongly influence customers.
- What customers gain from using spot instances are:
- Significantly lower prices for cloud computing.
- Huge capacity workloads processed in the evenings and nights could be done faster than doing this during working hours with human supervision.
Challenges facing customers are:
- Need to learn to do processing as batch workloads.
- Have to divide own resources into critical ones executed on on-demand instances and those that may be interrupted to run on SPOT instances.
- For everyone and our planet:
Gains:
- Overall less power consumption on running cloud infrastructure.
- Less carbon footprint on infrastructure manufacturing.
- Less natural resource consumption to build server rooms and produce hardware.
Want to learn how to start using spot instances? Read a short guide How to use Spot Virtual Machines.
For more information about spot instances, go to the eCommerce platform. Find out how to test Spot VMs for free.
How to use Spot instances?
by Mateusz Ślaski, Sales Support Engineer, CloudFerro
What are Spot Virtual Machines?
Spot instances are cloud computing resources (virtual machines) available at discount prices. They run using unused provider capacity and may be stopped when the demand for standard-priced resources increases.
CloudFerro implementation of Spot instances
Typical Spot Virtual Machines implementations provide floating prices depending on resources availability. CloudFerro Cloud offers a simplified Spot instances pricing model. Spot instances are available for high-memory, GPU-equipped and ARM CPU-based instances. The prices are flat and not related to changes in availability of resources.
At the time of writing this article, Spot instances prices were:
- 2 times cheaper for GPU-equipped instances
- 3 times cheaper for high-memory instances
- 1.8 times cheaper for ARM-based instances
If cloud resources are available, Spot instances may be launched.
The general documentation about Spot instances usage is “Spot instances on CloudFerro Cloud” https://docs.cloudferro.com/en/latest/cloud/Spot-instances-on-CloudFerro-Cloud.html. It covers important technical details. However, it does not provide more hints on when and how to use Spot instances effectively.
Usage examples
Spot instances are a great choice for:
- Stateless services.
- Short life-span entities.
- Workloads that can quickly dump current data and status when an interruption signal comes.
- Jobs that can be divided into smaller steps executed separately.
Or any combination of the above.
More specific examples are described below.
Test environments with short lifetimes
QA teams often create test environments using IaaS tools, automatically deploy software to be tested execute manual or automated tests, and finally destroy the complete environment. Such test environments have short lifetimes measured in minutes or, at most, hours.
The situation where such tests might be sometimes cancelled due to instance eviction can be acceptable when tests environments costs significantly less.
Additionally, the environment provisioner can be configured so that if Spot instances are not available, on-demand instances will be used for this single test occurrence.
Web services
Most web services can be based on stateless services.
However, you need to plan resources for stable service operation for low and medium load as in case of load spikes. You can configure auto-scaling tools to run on demand instances for low and medium load and attempt running the services necessary for spike handling using Spot instances if they are available. The cost of spike handling is significantly lower. Since service instances dedicated to handling load spikes typically have a short lifespan, the chance of eviction is relatively low.
Another scenario in this area is to go further with this economical approach and configure scaling in a way that on-demand instances are used only for a low constant load range. All instances required to fulfill medium and high load demand would be run on Spot instances. However, with this approach monitoring and eventually replacing evicted Spot instances with on-demand instances would be crucial to assure your service quality.
Batch processing
You can use Spot instances as processing workers if your batch process can be divided into smaller tasks or steps, and the processing workflow is configured in such a way that the entire workflow does not pause or stop in case of stopping or failure of a single step.
The general architecture for such a solution should consist of:
- Persistent storage
This will be the place for all input data, temporary results saved after each calculation step and results. Technically it can be:- An on-demand instance with:
- An NFS server with block storage volume attached.
- A dedicated service or database.
- A bucket in object storage.
- An on-demand instance with:
- Workers on Spot instances.
They will process the work in possibly small sub-batches saving output to persistent storage. - Persistent VM acting as a control node or other work scheduling/coordination solution.
All workers should check the status of tasks to be executed here and report which tasks they are taking to avoid repeated tasks or worse, falling into a deadlock.
This part is not a must. You may design the entire process and prepare workers software in such a way that coordination is performed by them - usually by saving work status on storage. However, a dedicated coordination node would contain additional logic and simplify monitoring status and progress.
Spot Virtual Machines Implementation tips
Resource availability and allocation order
As mentioned at the beginning of this article, Spot instances may be provisioned if cloud contains enough resources for the selected flavor.
If many users started allocating Spot instances resources at the same time, all of them would be treated with the same priority. Instances would be created in an order that requests to the OpenStack API are received.
Speed up instances provisioning by launching them from dedicated image
In the case of Spot instances, fast VM activation is needed. The best practice to achieve this is to
- Install all needed software on a standard VM with the same or smaller flavor than the expected Spot instances flavor.
- Test it.
- Create a snapshot image from the VM.
- Use this image as the source of final Spot instances.
If you do not have much experience with virtual machine images maintenance, you may find it beneficial to learn from available resources and develop your own procedure and tools. I strongly recommend using automation scripts, dedicated tools such as OpenStack Diskimage-Builder, or automation tools like Ansible. Infrastructure as a code tools, as for example Terraform, should be considered.
Below, you will find a simple example of how you can prepare such image using a user-data option when creating the instance.
Please create a new VM using the following command:
openstack server create --image MY_WORKER_IMAGE --flavor spot.hma.large --user-data MY_INSTALL_SCRIPT.sh VM_INSTANCE_NAMEWhere MY_INSTALL_SCRIPT.sh contains for example:
#!/bin/sh
apt-get update
apt-get install -y python3 python3-virtualenv
sudo -u eouser bash -c \
'cd /home/eouser && \
virtualenv app_venv && \
source ./app_venv/bin/activate && \
git clone https://github.com/hossainchisty/Photo-Album-App.git && \
cd Photo-Album-App && \
pip install -r requirements.txt'
A VM created in this way will have:
- Python installed.
- An example application.
- Created virtual environment.
- All application requirements installed within the virtual environment.
You can then create an image from this machine by executing the following commands:
openstack server stop VM_INSTANCE_NAME
openstack server image create VM_INSTANCE_NAME --name IMAGE_NAME
The image IMAGE_NAME may be used as a source to create Spot instances with the same or higher resource requirement flavor.
Reacting on an instance termination attempt
The documentation “Spot instances on CloudFerro Cloud” https://docs.cloudferro.com/en/latest/cloud/Spot-instances-on-CloudFerro-Cloud.html mentions that instances can be tagged during their creation or later with callback_url:<url value> tag.
This allows us to react when the OpenStack scheduler tries to delete our Spot instance.
The first reaction option is to convert the instance to an on-demand instance. You need to prepare a persistent service able to receive message about the attempt to delete the instance. Then include the dedicated endpoint’s full address in the tag. When the service receives the instance UIID in message, it should execute script containing the following OpenStack client commands:
openstack server resize --flavor NON_SPOT_FLAVOR VM_INSTANCE_UIIDWhen output of command:
openstack server list -f value -c ID -c Status | grep VM_INSTANCE_UIIDshows the status VM_INSTANCE_UIID VERIFY_RESIZE,
then the resize may be confirmed with a command:
openstack server resize confirm VM_INSTANCE_UIIDHowever, we need to consider the following:
- The resize process forces instance to reboot, so if your workload is not prepared, you may lose your data.
- It is not possible to resize this instance back to a spot flavor.
Manual resizing from a spot flavor to on-demand is also possible from the Horizon GUI, but it should be treated as a planned preventive action because humans usually would not have any time to react with the resize after receiving the notification.
If your processing software can save the current state or temporary result, the second reaction option is to place the service on the instance and activate it on a system boot. Then, you need to tag the instance with its own IP address in URL in “callback_url” tag.
When the service on the instance receives a message with information about the instance delete attempt, it may trigger the interruption of the workload and save the current state or temporary result on the persistent storage. In this way, the job can be continued by another still active Spot instance or on an on-demand instance (already active or provisioned if selected number of workers is requested).
Flexible spot instances
When creating Spot instances, you may need to hardcode some configuration data, such as the addresses of input data servers or storage destinations for the results. This can be done using the solution provided in the previous section. However, if you wish to run many different projects, customizing the instance becomes necessary.
A simple functional solution is to:
- Prepare your software to use configuration provided in environment variables
- Inject those variables values thru “cloud-init” when the instance is created
For example, you can create an instance in this way:
openstack server create --image MY_WORKER_IMAGE --flavor spot.hma.large --user-data MY_CONFIG_FILE.yaml VM_INSTANCE_NAMEIf your program retrieves data and saves results to REST API endpoints, MY_CONFIG_FILE.yaml could contain:
#cloud-config
runcmd:
- echo "INPUT_DATA_API='https://192.168.1.11/input/'" >> /etc/profile
- echo "OUTPUT_DATA_API='https://192.168.1.11/output/'" >> /etc/profile
- echo "DATA_USER='username'" >> /etc/profile
This file can be generated from a template manually or by a tool/script.
If you are using Terraform, the configuration can be applied using Terraform variables in this way:
#cloud-config
runcmd:
- echo "INPUT_DATA_API='${var.input_data_api}'" >> /etc/profile
- echo "OUTPUT_DATA_API='${var.input_data_api}'" >> /etc/profile
- echo "DATA_USER='username'" >> /etc/profile
Releasing spot instances resources
Using spots is related to the demand for lowering the costs.
If you wish to release resources when the workload is done to minimize the costs even further, then you can consider the following:
- Install and configure a load monitoring tool on the image used to create instances. Check periodically for idle instances, then manually delete idle instances.
- Design and develop notifications about finished tasks into your workload software. Then manually delete the idle instance after receiving a notification.
- Upgrade the previous solution with notifications sent to a software agent working on the persistent VM which can automatically delete idle instances. This solution would be beneficial when the savings from deleting idle instances exceed the cost of maintaining a persistent VM based on a cheap, low-resource flavor.
- Finally, you can build the capability for our software to self-destruct the instance. This can be done in this manner:
- Configure the image with an OpenStack client and credentials.
To do this, follow the steps provided in the documents:
“How to install OpenStackClient for Linux on CloudFerro Cloud” https://docs.cloudferro.com/en/latest/openstackcli/How-to-install-OpenStackClient-for-Linux-on-CloudFerro-Cloud.html
and
“How to generate or use Application Credentials via CLI on CloudFerro Cloud” https://docs.cloudferro.com/en/latest/cloud/How-to-generate-or-use-Application-Credentials-via-CLI-on-CloudFerro-Cloud.html
and information given in the previous chapter “Speed up instances provisioning by launching them from dedicated image”
- Building into your application procedure accessing "http://169.254.169.254/openstack/latest/meta_data.json" to retrieve the instance UUID and then executing self-destruct with command:
openstack server delete INSTANCE_UUIDKubernetes Autoscaling
We can avoid many of the previous traps by moving to the next level of abstraction: using a Kubernetes cluster created with OpenStack Magnum, featuring autoscaling on Spot instances. With this solution, Spot instances will be used to create Kubernetes cluster nodes when necessary. When the demand for resources decreases, nodes will be automatically removed after a configured autoscaling delay.
As autoscaling and eventual node eviction will be performed on the separated and dedicated node group, then core services on the default-workers node group will not be affected. This solution is cost-effective if the cost of maintaining a working cluster is lower than keeping idle Spot instances. You need to:
- Create a production cluster with 3 control nodes and a minimum one work node. More details can be found in one of the CloudFerro Cloud mini-guides.
- Read documentation about node groups https://docs.cloudferro.com/en/latest/kubernetes/Creating-Additional-Nodegroups-in-Kubernetes-Cluster-on-CloudFerro-Cloud-OpenStack-Magnum.html
- Create a new node-group using one of spot.* flavors.
For example:
openstack coe nodegroup create --min-nodes 1 --max-nodes 3 --node-count 1 --flavor spot.hma.medium --role worker CLUSTER_NAME spot-workersThis command crates a node group named “spot-workers” with a single node activated just after the group creation, and maximum 3 nodes.
Note that explicit definition of all options from the command above is necessary to activate autoscaling on the new group.
Define the affinity of all your persistent services to the node group default-worker.
Follow the example of Kubernetes deployment definition:
apiVersion: v1
kind: Pod
metadata:
name: ubuntu-pod
spec:
affinity:
  nodeAffinity:
  requiredDuringSchedulingIgnoredDuringExecution:
    nodeSelectorTerms:
    - matchExpressions:
    - key: magnum.openstack.org/nodegroup
      operator: In
      values:
      - default-worker
containers:
- name: ubuntu
  image: ubuntu:latest
command: ["sleep", "3600"]- Define the affinity of worker pods to the node group based on spot instance nodes. Follow the example of Kubernetes deployment definition. Remember to replace “spot-workers” name with your node-group name if you use another one:
apiVersion: apps/v1
kind: Deployment
metadata:
name: counter-log-deployment
labels:
  app: counter-log
spec:
replicas: 4
selector:
  matchLabels:
  app: counter-log
template:
  metadata:
  labels:
    app: counter-log
  spec:
    affinity:
    nodeAffinity:
      requiredDuringSchedulingIgnoredDuringExecution:
      nodeSelectorTerms:
      - matchExpressions:
        - key: magnum.openstack.org/nodegroup
        operator: In
        values:
        - spot-workers
  containers:
  - name: counter-log
    image: busybox:1.28
    args: [/bin/sh, -c, 'i=0; while true; do echo "$i: $(date) $(hostname) $(uuidgen)-$(uuidgen)"; i=$((i+1)); sleep 1; done']
    resources:
    requests:
      cpu: 200m
Final Thoughts
Using Spot instances certainly brings significant cost savings, but it also provides several other benefits:
- You gain a better understanding of how cloud virtual machine instances work and how to efficiently create, configure, and initialize them.
- IaaC. If you do not use this already, with staring using spots you have opportunity to learn and start to use Infrastructure as a code tools as Terraform.
- Failure (spot eviction) is not an accidental behavior but a feature. Fault tolerance must be a core part of the system design.
- In the case of long-running processes:
- You need to better understand the workflow to split it into smaller chunks that can be processed by SPOT instances. This may provide an opportunity to enable or improve parallel data processing.
- Data structures for checkpoints and temporary data should be analyzed, which may lead to data size optimization. - Adding components dedicated to coordination gives an opportunity to implement detailed monitoring of the entire system’s processing status and progress.
Key benefits of using public cloud computing platform based on open source technologies
By Marcin Kowalski, Product Manager - CloudFerro
Open source technologies are the foundation of many modern IT environments. They can also act as the basis for cloud computing infrastructure, including platforms operating on a great scale.
Open source technologies i.e. based on an open code, allow their users to become independent of many aspects, including geopolitical factors. Such solutions also make it tremendously easier to ensure superior scalability. In this article we present the benefits that open source can bring, and find out why some cloud service providers are betting on open source technologies.
Let us take as an example our cloud computing services, where we build and operate clouds for collecting, storing, sharing, and processing various satellite data on behalf of institutions such as the European Space Agency, the European Organization for the Exploitation of Meteorological Satellites (EUMETSAT), and the European Centre for Medium-Range Weather Forecasts (ECMWF), among others. Every day, we provide thousands of users around the world with access to PB-counted volumes of data delivered by the Sentinel constellation’s European satellites, and a cloud environment designed specifically for their processing.
The nature of the data processed defines significantly the cloud computing architecture. With regards to satellite data, it is crucial to ensure the highest possible availability of both historical and current data (satellite data is available to the user within 15 minutes after it is generated), as well as the scalability and stability of long-term development. This is possible through the use of open source technology and the competences of the provider's team.
Open source as the foundation for cloud computing platform
CloudFerro's cloud platform has been built from scratch using open source technologies as a multitenant environment. We address our services to large European public institutions, and the vast majority of them prefer open-code solutions. From their perspective, open source means the ability to guarantee the continuity of IT environments in the long term.
The ability to scale infrastructure horizontally, i.e. the fact that at some point we will not face a limitation in the ability to expand resources or the ability to support another group of users, is of great importance to the essence of the public cloud model.
From the perspectives of both the provider and the users of cloud environments based on open source solutions, this translates into a number of benefits. Let's summarize the most significant ones.
1. Avoiding the risk of vendor lock-in
In practice, it is important for the supplier, among other things, to ensure the independence of the hardware and application layers. This, in turn, eliminates possible risk of excessive attachment to a single vendor. Over-reliance on one vendor's solutions naturally poses a risk not only to business continuity, but also to the ability to freely set the directions of platform development.
Clients and providers need to make sure that the software we use as a basis for our services, and very often also for our business model, will be available, supported and developed in a long-term perspective. For instance, let’s look at a well-known case of VMware company who has changed its license model, ending the sale of perpetual licenses for their products, and transitioning to a subscription model. This has put many customers in a difficult situation as they have to take into account additional workload and expenses.
The modularity of this technology, that is quite natural for the open source approach, also meets these needs - both in the hardware and software layers. For instance, any component, or even the entire cloud computing technology stack, can be replaced at any time. This gives organizations using such solutions have, among other things, a degree of versatility and the ability of changing easily their cloud service provider. Workloads or data based on standard open source solutions can be directly migrated to another environment providing the same mechanisms. This also translates into new opportunities for ensuring business continuity.
2. High level of technological and operational security
A separate issue is the ability to fine-tune the environments based on open source solutions in line with customers’ or users’ needs. It is of great value that anyone, if they only wish, can thoroughly analyze the application code to fully understand how the entire technology stack works. Openness and technological transparency have impact on the level of data security and user burden.
Statistically, open code technologies do not stand out with a higher scale of vulnerabilities than closed solutions. There are hundreds or thousands of people working on particular solutions within the open source community, so there is a good chance that potential vulnerabilities will be quickly detected and neutralized. The specificity of CloudFerro's cloud services also requires ensuring high resilience and business continuity. This, in turn, is reflected in the framework of internal procedures and regulations implemented by the operator of the cloud.
Last but not least, understanding how the cloud platform components function on a low level, paves the way for implementing unique modifications to tailor its functioning to customers' specific needs.
3. Multi-user accessibility and data isolation of individual users
One thing that differentiates various solutions based on open source technologies is the ability to separate the data and processing used by different users of public cloud environments. This translates into non-obvious technology decisions.
A critical aspect that determines which technology stack will be selected to build public cloud environment is the ability to ensure full multitenancy and complete isolation of individual user's data in a transparent manner. There are a number of technologies that perform well in a single-tenant architecture, but far less well in a multi-tenant architecture. This is especially true in terms of data security issues.
At the same time, as our team’s experience shows, it is possible to build a multi-tenant cloud computing platform that provides full isolation of customer data based entirely on open source technologies. Ensuring end-to-end data separation of individual users of a single cloud environment - including users representing different organizations - is crucial in terms of security, as well as the ability to comply with regulations in certain industries.
4. Cloud platform functional development and adaptation to particular needs
The ability to customize or change the solutions that make up a cloud platform are also beneficial to customers as they can have a much greater impact on setting the development priorities than in case of closed-code solutions.
In the case of closed solutions, their users have a fairly limited influence on the directions of technology or feature development. With open source solutions, the possibilities for determining the vectors of such changes are generally very broad. However, they pose business and technical challenges.
The base for such plans is, obviously, the dialogue between the client and the provider. For many institutions, the very possibility of negotiating the cloud platform development roadmap means greater freedom in defining strategic business plans.
However, in terms of customizing standard capabilities of the open source technology stack, the experience and competence of the team are of great importance, as well as the scale of operations that affects the effectiveness of customization projects.
Naturally, it is unlikely that a single organization is able to implement all ideas on its own, but it can envision at least the direction of the necessary changes. In large-scale organizations like CloudFerro, such a discussion mainly comes down to setting priorities and gradually implementing planned changes. In this sense, open source is much safer and more flexible than closed-code solutions.
5. Freedom to switch suppliers
The greater flexibility of open source technology also means hardware independence. From the vendor's perspective, it is easier to change various elements of the technology stack. For users, it provides greater freedom to migrate workloads to another platform, whether cloud-based or on-premise.
The technology standardization is key here. As the solutions used are technologically similar, they can be more clearly priced, which in effect makes it possible to compare offers of different suppliers. At the same time, technological consistency ensures that the possibility to change supplier is technically feasible with relatively little effort.
In this context, standardization at the level of the technology stack, regardless of possible functional or technological adjustments, leads to into greater universality and versatility in the use of cloud platforms in the face of dynamically changing needs.
6. Price, quality and functional competitiveness
The example of CloudFerro platform shows that the software layer can play a significant role in terms of differentiating cloud platforms in the market. From the providers' perspective, independence in composing the technology stack and freedom of choosing hardware create unique opportunities to compete on price, quality and functional scope of the cloud environment. In turn, from the customers' point of view, these attributes are a significant differentiator between cloud environments based end-to-end on open source solutions and other cloud computing services, particularly those using closed-code technologies. Greater flexibility in terms of cost, quality and functionality, among other things, means the ability to fine-tune the way the entire cloud platform operates to suit unique needs. Significant differences also exist between environments based on open source technologies.
Our customers expect open source solutions. They don't want closed technologies because they are aware of the potential risks associated with them. Instead, they know that open and closed technologies can provide the same values.
Enhancing Earth Observation capabilities - satellite data applications and implications
By Maciej Myśliwiec, Planet Partners
The view from space offers an expanded perspective on Earth. It is remarkable how data can be obtained and comprehended through satellite-based Earth observation. Sixty-five years after the launch of the first artificial satellite, space technology continues to provide an immense volume of data utilized by analysts and scientists worldwide, enabling the development of solutions across various disciplines. Let us explore the breadth of observations that can be done from space!
Currently, over 4,500 artificial satellites orbit our planet. Among them, there are the satellites of the European Union’s Copernicus programme – the leading provider of satellite data in Europe. Each day Copernicus delivers over 12 terabytes of data that is freely accessible to all users. With a simple internet connection, one can access the extensive collection of satellite images gathered since the programme's inception in 2014, with the launch of the first Sentinel-1A satellite.
Managing and processing such vast amounts of data necessitates substantial computational and storage resources. Earth Observation (EO) platforms like CREODIAS provide users with the means to transform EO data into valuable information. CREODIAS currently houses a repository of over 34 petabytes of data and an integrated cloud computing environment, enabling efficient processing of EO data.
Presently, half a million users of the Copernicus programme process more than 16 terabytes of data daily. To put this into perspective, 1 terabyte equates to approximately 250,000 photos captured by a 12-megapixel camera or 500 hours of high-definition video footage. Hence, we speak of millions of images and substantial quantities of other data (e.g., from satellite sensors) generated within the European programme every single day. The easy accessibility of satellite data fuels innovation across various industries and scientific domains. The current market turnover for Earth observation data is estimated at €2.8 billion, with over 41% of the European industry relying on data obtained from Earth observation programmes.
In recent times, several initiatives have emerged to facilitate data access and processing for scientists, researchers, public administrations, the private sector, and the general public. One of these initiatives is the Copernicus Data Space Ecosystem, which aims to provide comprehensive spatial and temporal coverage of Copernicus EO data, immediately accessible to all users free of charge, along with cloud computing resources for further data processing. Another notable initiative is Destination Earth, the flagship project of the European Commission that strives to develop an advanced digital model of the Earth powered by European supercomputers (HPC) and state-of-the-art artificial intelligence technologies.

The convenient access to current and historical Earth Observation data enhances planning and decision-making across diverse fields. How can we leverage these vast resources of satellite data?
Environmental research and climate change
One of the primary applications that come to my mind is the study of climate change and meteorology. EO data plays a crucial role in developing meteorological models for weather forecasting, preparing for and mitigating natural disasters, as well as monitoring and addressing climate change.
Accurate knowledge of current land cover and land use is pivotal for effective planning and management by local and regional authorities. Areas under the jurisdiction of public administration institutions, such as national parks, wetlands, lakes, riverbeds, and coastlines, benefit immensely from open satellite data captured by Sentinel-1 and Sentinel-2 satellites. These data offer extensive possibilities for managing such areas with minimal effort. Even 10-meter multispectral data is sufficient for a range of environmentally significant applications, including drought monitoring, flood management, freshwater ecosystem health assessment, forest cover analysis, biodiversity monitoring, air quality monitoring, and land surface temperature analysis.
Sentinel satellite missions, part of the European Copernicus programme, have revolutionized Earth research since 2014. The ubiquitous availability of freely accessible satellite data is complemented by specialized tools that enable their processing and analysis, converting raw data into actionable information.
Illustrative examples of climate change analysis tools include:
- "Global temperature trend monitor": an application that monitors global air temperature changes on Earth's surface over recent decades.
- "Climate monitoring and volcanic eruptions": an application studying volcanic eruptions, which can cause short-term climate effects on a global and regional scale, contributing to natural climate variability.
- "European temperature statistics derived from climate projections": an application providing European temperature statistics for historical periods (1976-2005) and projected 30-year periods (2031-2060 and 2071-2100) under different climate change scenarios.
These applications represent a fraction of the vast array of possibilities available to users of satellite data programs, tailored to address their specific research inquiries.
Forestry
Most forests are managed by state-owned enterprises for timber production, which significantly contributes to national budgets. Effective forestry management requires comprehensive knowledge of soil characteristics, water dynamics, climate conditions, and microclimates across expansive and sometimes challenging-to-access areas. Satellite data offers valuable insights into forest dynamics and their influence on climate patterns. Real-time spaceborne data serves as an invaluable tool for locating forest fires, monitoring plant diseases, and assessing the impact of drought on tree health.
Agriculture
Earth Observation supports various agricultural processes. At the local level, data assists in identifying optimal locations for cultivation, predicting crop yields, and maintaining records of agricultural parcels. Advanced remote sensing techniques, such as Synthetic Aperture Radar (SAR) and hyperspectral analysis, are increasingly being applied in precision agriculture. At regional or national scales, EO data facilitates land cover classification and supports the implementation of programs aimed at agricultural development and direct subsidies for farmers.
Spatial planning
Satellite data plays a vital role in spatial planning for both urban and rural landscapes. Leveraging EO data, one can conduct detailed surveys and complex analyses of areas of interest. Currently, imagery serves as a primary source of information for formulating up-to-date spatial development plans, considering changes in land use and cover, identifying new areas for investment, and detecting wetland areas. Copernicus Sentinel-2 data, for instance, provides rapid and comprehensive insights into current and historical phenomena. Investors seeking to expand their activities in remote regions greatly benefit from information on the status of potential investment areas.
Urban heat islands
Satellite-based Earth observation data also contributes to urban management, including the monitoring and mitigation of urban heat islands, characterized by significantly higher air temperatures within urban areas compared to adjacent rural regions. Unlike traditional point-based air temperature measurements from monitoring stations, satellite data enables the measurement of surface temperatures at any location within a city. This capability facilitates the development of spatial patterns critical for understanding the phenomenon and aids local authorities in taking necessary measures to improve residents' quality of life.
Maritime transport and logistics
Satellite imagery plays a crucial role in the monitoring and detection of vessel traffic on seas and oceans. It also supports the management of maritime economies and ensures the safe transportation of valuable commodities such as liquefied chemicals and crude oil. In the event of accidents, EO images provide timely assistance in mapping the consequences. Combining EO data with Automatic Identification System (AIS) information yields a powerful tool for monitoring marine objects and phenomena, including coastal monitoring and analysis of changing water depths.
Crisis management
Natural disasters like floods, wildfires, and storms often have a wide spatial extent. Open satellite data forms the foundation for the detection and monitoring of such events. Specialized methods, relying on environmental and atmospheric satellite data, are employed to detect favourable conditions and early warning signs of potential natural hazards like droughts or algal blooms in lakes or seas. Synthetic Aperture Radar (SAR) image processing is recommended for monitoring land movement, particularly for applications such as landslide risk detection, vital for mining and mountain tourism. Very high-resolution data plays a crucial role in assessing building disasters, managing mass events, and ensuring the security of government and military facilities.

Natural disasters like floods, wildfires, and storms often have a wide spatial extent. Open satellite data forms the foundation for the detection and monitoring of such events. Specialized methods, relying on environmental and atmospheric satellite data, are employed to detect favourable conditions and early warning signs of potential natural hazards like droughts or algal blooms in lakes or seas. Synthetic Aperture Radar (SAR) image processing is recommended for monitoring land movement, particularly for applications such as landslide risk detection, vital for mining and mountain tourism. Very high-resolution data plays a crucial role in assessing building disasters, managing mass events, and ensuring the security of government and military facilities.
Satellite imagery provides an insightful perspective on the locations and magnitudes of flooding events. These visual data enable the identification of inundated regions, assessment of soil and vegetation moisture levels, and the prediction of areas potentially vulnerable to flash floods. Earth Observation platforms like CREODIAS house an extensive array of such images, inclusive of superior-resolution datasets from esteemed programs such as Copernicus. Users have the opportunity to peruse diverse images, categorize them chronologically or geographically, and thus acquire a more profound comprehension of flood dynamics.
When combined with ground-level measurements, satellite-based remote sensing offers an in-depth perspective on global drought trends. Meteorological satellites play a crucial role in monitoring key environmental indicators such as humidity, temperature, and wind, which help predict periods of limited rainfall that can subsequently lead to dry soil conditions and stressed vegetation, commonly referred to as agricultural droughts. To support this analysis, the Copernicus programme provides an array of tools tailored to drought assessment. When it comes to hydrological droughts, which signify water shortages within certain regions, advanced satellite imagery becomes indispensable. One of the standout techniques in this domain is SAR – Synthetic Aperture Radar, which is a type of radar imaging that uses radio waves to capture detailed images of the Earth's surface, making it possible to detect even subtle changes in water levels and providing valuable insights into drought conditions.
Assessment of war-related environmental damage
Satellite data proves invaluable during wars and armed conflicts. However, its utility extends beyond military applications. By processing data, it becomes possible to estimate the scale of environmental destruction or predict actions necessary for post-war reconstruction. An example of such an initiative is EO4UA (Earth Observation for Ukraine), which aims to support Ukrainian institutions and international organizations in assessing the environmental damage caused by war activities within Ukraine. EO4UA activities are conducted in a cloud computing environment integrated with a substantial repository of Earth observation data, encompassing various datasets, such as satellite imagery, crop classifications, forest fire extents, and more, necessary for comprehensive environmental analysis.
The above-mentioned areas provide only a glimpse into the diverse applications of EO data. As we witness rapid technological advancements in space technologies, we can anticipate gaining unprecedented insights into the Earth's ecosystems. We believe that the future will bring a deeper understanding of our planet, facilitated by rapidly evolving satellite data technologies. Equipped with these advancements, we will be better prepared to address environmental challenges on our planet, fostering a more optimistic outlook for the future of Earth.
Direction Earth – European projects in the service of sustainable development
By Michał Bylicki, Sales & Business Development, CloudFerro
Sometimes you can't help but be amazed at the speed of technology development. New tools improve our efficiency, help solve problems, and facilitate everyday activities at work and in play. This is largely due to the availability of increasingly larger data sets and increasingly powerful computing resources to process them.
However, new technologies have an impact on the natural environment, climate, and humans. While generating undoubted benefits, they also carry certain threats. Therefore, it is important that the development of new technologies supports human health and safety and serves, or at least does not harm, the natural environment.

Many companies take into account social and environmental factors and costs in their activities, which, from the point of view of society, are more important than the profits of an individual company. However, this is not always enough, which is why this process is supported at the European and national levels.
One method is to limit undesirable activities through appropriate legislation (e.g., limiting emissions or prohibiting polluting activities). Another way is to introduce initiatives that promote green technological transformation. In Europe, such initiatives include the European Green Deal, Digital Europe, and the European Strategy for Data.
These initiatives involve developing competencies and services in Europe, taking into account the principles of sustainable development. The European Green Deal assumes achieving climate neutrality by 2050, reducing emissions by at least 55% by 2030, decoupling economic growth from fossil fuel consumption, and a just transition. Digital Transformation aims to achieve digital and technological sovereignty in Europe, digitise industry, and ensure access to data while assuring its protection and fair competition. As part of its data strategy, the European Union aims to create a European data market.
One of the most interesting projects related to the above-mentioned initiatives is Destination Earth (DestinE), to create a digital replica of the Earth to model all processes observable on Earth in various ecosystems (e.g. atmospheric and climatic phenomena, forest ecosystems, glaciers, agricultural monitoring and others).
The DestinE initiative consists of several components and is implemented by ESA, ECMWF, and EUMETSAT in collaboration with industry. It is based on data from various sources and very high computing power (HPC and cloud computing). To facilitate the availability and effective use of data, a Data Lake infrastructure has been created to store, process and share data needed for Digital Twin Earth (DTE) processing. The initiative also uses Earth observation data, including data from the Copernicus programme, one of the largest open data sources (available to anyone at no charge through the Copernicus Data Space Ecosystem).
The combination of open access to data with computing power and convenient tools for processing allows companies and institutions dealing with climate monitoring and nature protection to analyse air, water, and soil pollution effectively. It also helps monitor natural hazards such as floods, earthquakes, and fires, supporting prompt action in the event of disasters.
Of course, increased data processing also means higher energy consumption, which is why optimising data processing and storage is even more critical. In this case, using cloud resources turns out to be more beneficial.
Firstly, most cloud providers use renewable energy sources whenever possible and optimise energy consumption. Secondly, using shared resources increases resource utilisation and avoids maintaining and powering unused resources. Thirdly, in the case of demand for Peta bytes of data, processing nearby data is much more effective than transferring it, e.g. to local infrastructure and keeping a local copy of the data.
Ambitious projects, such as DestinE, stimulate technological development, taking into account the principles of sustainable development. They enable observation, more detailed examination of natural processes, and reflection of processes in the real world. They help transform data into information. This way, they increase our knowledge of the world and help us make informed decisions.
At CloudFerro, we contribute to achieving European environmental and technological goals because:
- One copy of data serves thousands of users, a processing chain is more effective in the cloud.
- The use of satellite data enables quick response to phenomena that threaten the natural environment.
- Immediate access to data allows for quick reactions to crisis situations.
- Access to historical and global data allows the observation of trends and comparing them across periods and locations.
- We use and contribute to Open Source technologies, develop competencies locally, and ensure digital sovereignty in Europe and fair competition in the cloud services market.
- We power our clouds with renewable energy sources and optimise processing chains.
- We do not violate the privacy and property of user data.